. 2005 Oct;17(10):2676-92.
doi: 10.1105/tpc.105.033415. Epub 2005 Aug 26.

The tomato Aux/IAA transcription factor IAA9 is involved in fruit development and leaf morphogenesis

Affiliations

The tomato Aux/IAA transcription factor IAA9 is involved in fruit development and leaf morphogenesis

Hua Wang et al. Plant Cell. 2005 Oct.

Abstract

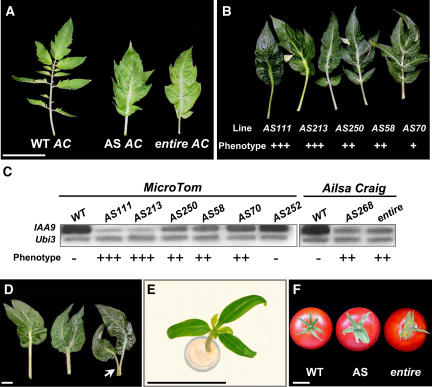
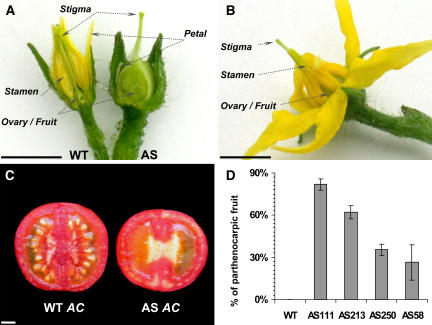
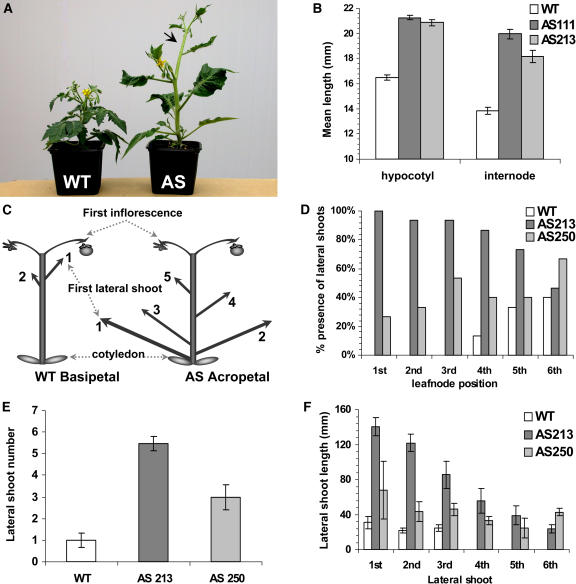
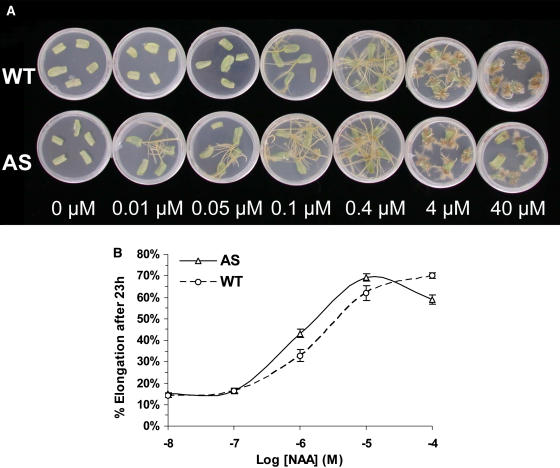
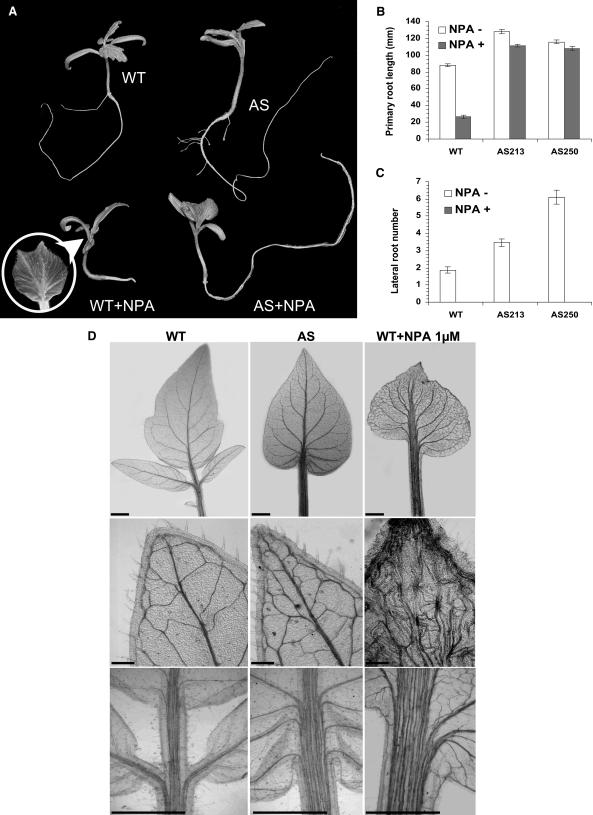
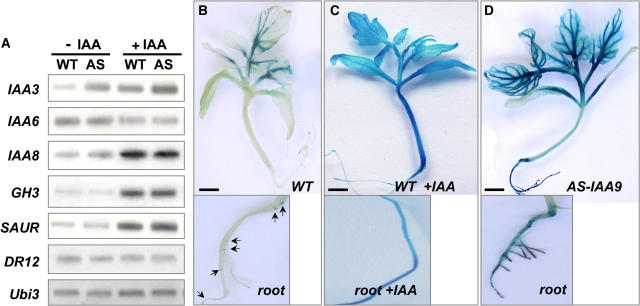
Auxin/indole-3-acetic acid (Aux/IAA) proteins are transcriptional regulators that mediate many aspects of plant responses to auxin. While functions of most Aux/IAAs have been defined mainly by gain-of-function mutant alleles in Arabidopsis thaliana, phenotypes associated with loss-of-function mutations have been scarce and subtle. We report here that the downregulation of IAA9, a tomato (Solanum lycopersicum) gene from a distinct subfamily of Aux/IAA genes, results in a pleiotropic phenotype, consistent with its ubiquitous expression pattern. IAA9-inhibited lines have simple leaves instead of wild-type compound leaves, and fruit development is triggered before fertilization, giving rise to parthenocarpy. This indicates that IAA9 is a key mediator of leaf morphogenesis and fruit set. In addition, antisense plants displayed auxin-related growth alterations, including enhanced hypocotyl/stem elongation, increased leaf vascularization, and reduced apical dominance. Auxin dose-response assays revealed that IAA9 downregulated lines were hypersensitive to auxin, although the only early auxin-responsive gene that was found to be upregulated in the antisense lines was IAA3. The activity of the IAA3 promoter was stimulated in the IAA9 antisense genetic background, indicating that IAA9 acts in planta as a transcriptional repressor of auxin signaling. While no mutation in any member of subfamily IV has been reported to date, the phenotypes associated with the downregulation of IAA9 reveal distinct and novel roles for members of the Aux/IAA gene family.


Figures

Figure 1.
Figure 1.
Sequence Analysis of IAA9. Sequence comparison of IAA9, putative orthologs from other plants, and other members of the Aux/IAA protein family. Conserved residues are shaded in black, dark gray shading indicates similar residues in at least 7 out of 12 of the sequences, and light gray shading indicates similar residues in 4 to 6 out of 12 of the sequences. The four conserved domains I, II, III, and IV are underlined. Conserved basic residues that putatively function as NLS are indicated by closed circles on the top of the alignment. Putative polyproline II (Pxx)2 conformation residues are indicated by arrows.
Figure 2.
Figure 2.
IAA9 and Its Homologs Belong to a Distinct Subfamily of the Aux/IAA Gene Family. The resultant tree was obtained by a character state cladistic approach (Parsimony) using OsIAAa and OsIAA8 as the outgroups (chosen because of their relative isolation on preliminary calculations). Values above branches are bootstrap percentages (5000 replicates). The score of the best tree found was 4442 with consistency index of 0.6376 and homoplasy index of 0.3624.
Figure 3.
Figure 3.
Nuclear Localization of the IAA9 Protein Fused to a GFP Tag. Tobacco protoplasts were transiently transformed with either Pro35S:GFP or Pro35S:IAA9-GFP constructs, and the subcellular localizations of the IAA9-GFP fusion protein or the GFP were analyzed by confocal laser scanning microscopy (left panel). Light micrographs (middle panel) and fluorescence (left panel) images are merged (right panel) to illustrate the different location of the two proteins. Bars = 10 μm. CaMV, Cauliflower mosaic virus.
Figure 4.
Figure 4.
RT-PCR Analysis of IAA9 Expression Patterns. (A) IAA9 expression in different organs: roots (R), leaves (L), petiole (P), stem (S), flowers at anthesis (FL-A), flower buds (FL-B), immature green fruit (IM), mature green fruit (MG), red fruit (R), and seedlings (SL). (B) IAA9 expression at different stages of fruit development: early immature green (EIM), immature green (IM), mature green (MG), breaker (BR), orange (OR), early red (ER), red (R), and red ripe (RR). (C) IAA9 expression in expanding immature leaves (IML), fully expanded mature leaves (ML), aged, turning yellow leaves (OL), petioles (PE), terminal-leaflet blades (TB), lateral-leaflet blades (LB), and the second leaf counted from the cotyledon node (2L). (D) Transcript accumulation of IAA3, IAA2, IAA8, and IAA9 tomato Aux/IAA genes in response to auxin treatment (20 μM IAA) of tomato seedlings.
Figure 5.
Figure 5.
Vegetative Growth Phenotypes of IAA9 Downregulated Plants. (A) Tomato leaf morphology in wild-type Ailsa Craig (WT AC), IAA9 antisense (AS AC), and monogenic spontaneous mutant entire (entire AC) lines. Bar = 100 mm. (B) Positive correlation between the severity of the simple-leaf phenotype and the level of downregulation of the IAA9 gene in MicroTom genotype. AS111 and AS213 are strongly inhibited lines, and AS250, AS58, and AS70 are weakly inhibited lines. (C) RT-PCR analysis of IAA9 transcript accumulation in wild-type and antisense lines either in MicroTom (AS111, AS213, AS250, AS58, AS70, and AS252) or Ailsa Craig (AS268) genetic backgrounds and in entire mutant plants. Symbols indicate the presence (+) or absence (−) of leaf and parthenocarpy phenotypes. +++ designates lines with only simple leaves and a high percentage of parthenocarpy (60 to 100%); ++ designates lines showing both lobed and entire margin simple leaves and moderate percentage of parthenocarpy (30 to 40%); + designates lines displaying only lobed simple leaves and occasional parthenocarpy. (D) Leaf fusion in IAA9 antisense lines consists of either fused twin leaves appearing as a single leaf with two terminal apexes (left), one petiole bearing two lamina (medium), or two leaves partially fused at the end of the petiole and forming a pin-like structure (right) as indicated by the arrowhead. (E) Three-cotyledon structure often occurring in seedlings of strongly inhibited lines. (F) Fused sepals in antisense lines. Wild-type fruit bear symmetrically arranged calyx, and AS-IAA9 (AS) and entire plants exhibit asymmetrical and partly fused calyx. Bars = 20 mm in (D) to (F).
Figure 6.
Figure 6.
Fruit Set and Parthenocarpy in AS-IAA9 Lines. (A) Flower buds at 1 d before anthesis in wild-type and AS-IAA9 lines (AS), showing dramatically enlarged ovary and underdeveloped stamen in AS-IAA9 lines. (B) Precocious fruit development in AS-IAA9. (C) Wild-type Ailsa Craig seeded fruit (WT AC) and AS-IAA9 parthenocarpic fruit (AS AC). Bars = 10 mm in (A) to (C). (D) The level of parthenocarpy in AS-IAA9 tomato lines positively correlates with the level of downregulation of the IAA9 gene in independent AS-IAA9 lines. Error bars indicate mean ± se of at least five independent trials, n ≥ 200 fruits.
Figure 7.
Figure 7.
Increased Stem Elongation and Decreased Apical Dominance in AS-IAA9 Lines. (A) AS-IAA9 plants (AS) are taller than the wild type and have longer internodes (indicated by arrow). (B) Increased hypocotyl and stem elongation in IAA9 downregulated lines. The data show the hypocotyl mean length of 21-d-old seedlings and internode mean length of 50-d-old plants in wild-type and two independent AS-IAA9 lines in MicroTom genetic background (AS213 and AS111). The data are the mean ± se of at least 68 seedlings or plants and are representative of three independent experiments. (C) Diagram depicting the inverted pattern of axillary shoot development and reduced apical dominance in AS-IAA9 (AS) compared with wild-type plants. Numbers indicate the emergence order of lateral shoots. (D) Percentage of plants displaying a lateral shoot in each of the first six leaf nodes in wild-type and two antisense lines. (E) Increased total number of lateral shoots in AS-IAA9 lines. (F) AS-IAA9 lines bear longer lateral shoots. Error bars represent mean ± se of at least 15 plants in (E) and (F).
Figure 8.
Figure 8.
Enhanced Auxin Sensitivity in IAA9-Inhibited Lines. (A) Auxin dose–response assay of cotyledon explants. Root formation is induced by lower auxin (NAA) concentration in AS-IAA9 (AS) plants than in the wild type. Root regeneration is promoted at 0.1 μM NAA in the wild type and at 10 times lower concentration (0.01 μM) in AS-IAA9 lines. (B) Auxin dose response in hypocotyl segments. Elongation is given as percentage increase in final length over the initial length after 23 h incubation in a solution containing the indicated NAA concentration. The results are representative of data obtained with three independent AS-IAA9 lines: AS213, AS111, and AS250. Error bars represent mean ± se, n ≥ 20.
Figure 9.
Figure 9.
NPA-Treated Wild-Type Plants Phenocopy the Simple-Leaf Phenotype of AS-IAA9 Plants. (A) Mock treatments are presented in the top row, and NPA treatments (1 μM) are presented in the bottom row. NPA-treated wild-type seedlings reproduced the simple-leaf and leaf-fusion phenotypes (inset). (B) Effect of NPA treatment on primary root elongation in light-grown wild-type and AS-IAA9 plants. (C) Inhibition of lateral root formation in wild-type and AS-IAA9 lines (AS213 and AS250) upon NPA application. Error bars represent mean ± se (n ≥ 63). (D) Leaf vascular patterns in wild-type (left panels), AS-IAA9 (middle panels), and NPA-treated wild-type plants (right panels). Top row, overall views of venation pattern; middle row, close-up pictures of the leaf tips; bottom row, proximal region of midvein. Bars = 1 mm (top and bottom rows) and 100 μm (middle row).
Figure 10.
Figure 10.
Expression of Primary Auxin-Responsive Genes in IAA9-Inhibited Lines. (A) RT-PCR analyses of the expression of auxin-responsive genes (IAA3, IAA6, IAA2, GH3, SAUR, and DR12) in the wild type and IAA9-inhibited (AS) line (AS213) upon auxin treatment (20 μM IAA for 3 h). (B) Expression pattern of the auxin-inducible IAA3 promoter (ProIAA3) fused to the GUS reporter gene in wild-type seedlings. Inset contains enlarged picture showing GUS staining limited to small spots corresponding to the root tip and lateral root initiation sites (arrowheads). (C) Expression pattern of ProIAA3:GUS in wild-type seedlings treated with exogenous auxin (20 μM IAA). Inset shows GUS staining throughout the root. (D) Expression pattern of ProIAA3:GUS in AS-IAA9 background with no auxin treatment. Inset shows GUS staining present in all parts of the root system. Bars = 5 mm in (B) to (D).

References

    1. Abel, S., Nguyen, M.D., and Theologis, A. (1995). The PS-IAA4/5-like family of early auxin-inducible mRNAs in Arabidopsis thaliana. J. Mol. Biol. 251, 533–549. - PubMed
    1. Abel, S., and Theologis, A. (1994). Transient transformation of Arabidopsis leaf protoplasts: A versatile experimental system to study gene expression. Plant J. 5, 421–427. - PubMed
    1. Ainley, W.M., Walker, J.C., Nagao, R.T., and Key, J.L. (1988). Sequence and characterization of two auxin-regulated genes from soybean. J. Biol. Chem. 263, 10658–10666. - PubMed
    1. Balbi, V., and Lomax, T.L. (2003). Regulation of early tomato fruit development by the diageotropica gene. Plant Physiol. 131, 186–197. - PMC - PubMed
    1. Beyer, E.M., and Quebedeaux, B. (1974). Parthenocarpy in cucumber: Mechanism of action of auxin transport inhibitors. J. Am. Soc. Hortic. Sci. 99, 385–390.

Publication types

MeSH terms

Associated data