. 2005 Sep 6;102(36):12867-72.
doi: 10.1073/pnas.0503603102. Epub 2005 Aug 26.

Glucose transporter 1 expression identifies a population of cycling CD4+ CD8+ human thymocytes with high CXCR4-induced chemotaxis

Affiliations

Glucose transporter 1 expression identifies a population of cycling CD4+ CD8+ human thymocytes with high CXCR4-induced chemotaxis

Louise Swainson et al. Proc Natl Acad Sci U S A. .

Abstract

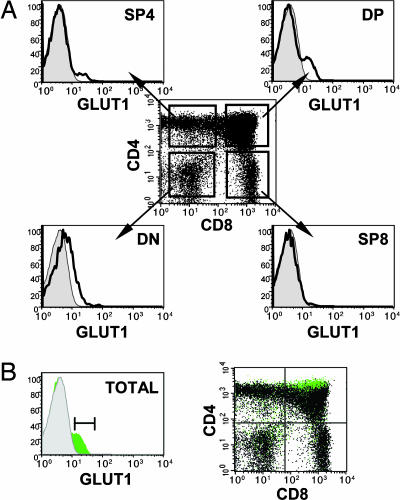
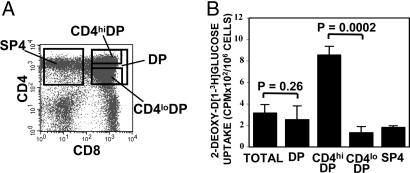
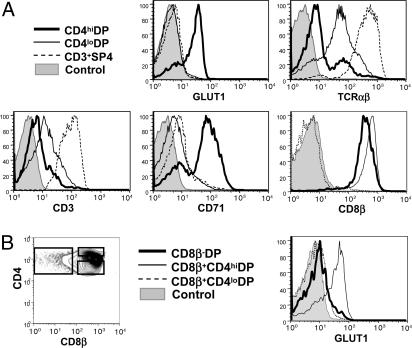
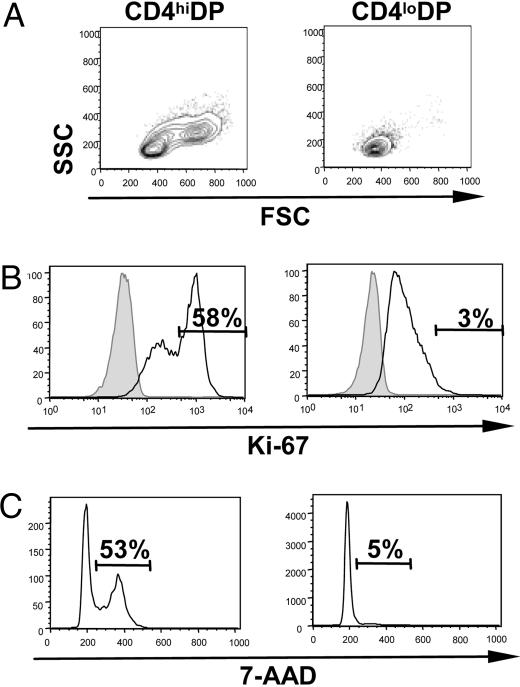
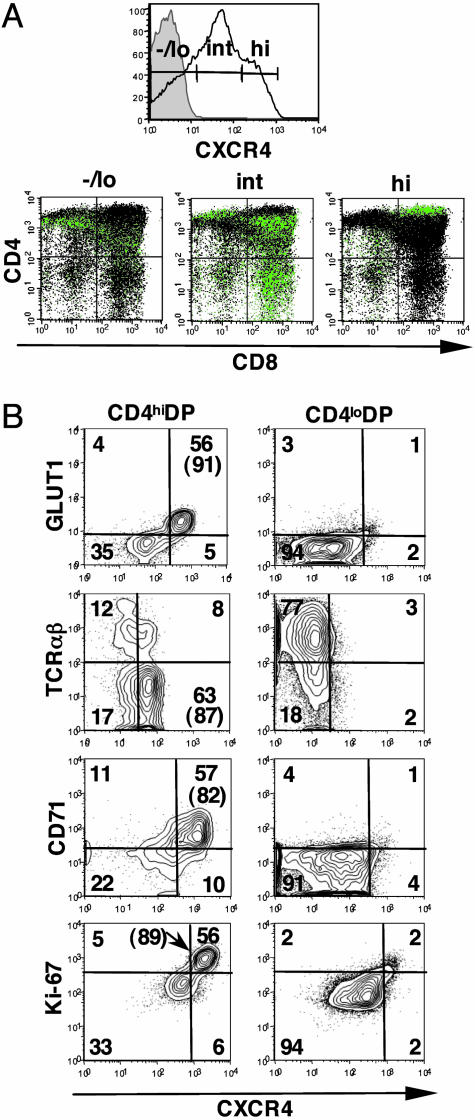
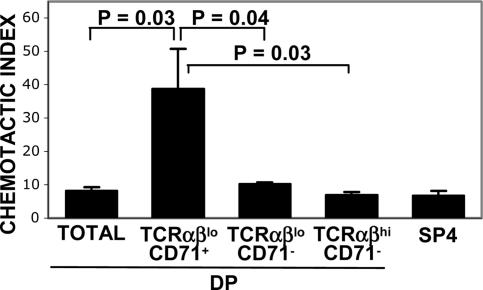
GLUT1, the major glucose transporter in peripheral T lymphocytes, is induced upon T cell receptor activation. However, the role of GLUT1 during human thymocyte differentiation remains to be evaluated. Our identification of GLUT1 as the human T lymphotrophic virus (HTLV) receptor has enabled us to use tagged HTLV-receptor-binding domain fusion proteins to specifically monitor surface GLUT1 expression. Here, we identify a unique subset of CD4+ CD8+ double-positive (DP) thymocytes, based on their GLUT1 surface expression. Whereas these cells express variable levels of CD8, they express uniformly high levels of CD4. Glucose uptake was 7-fold higher in CD4(hi) DP thymocytes than in CD4(lo) DP thymocytes (P = 0.0002). Further analyses indicated that these GLUT1+ thymocytes are early post-beta-selection, as demonstrated by low levels of T cell receptor (TCR)alphabeta and CD3. This population of immature GLUT1+ DP cells is rapidly cycling and can be further distinguished by specific expression of the transferrin receptor. Importantly, the CXCR4 chemokine receptor is expressed at 15-fold higher levels on GLUT1+ DP thymocytes, as compared with the DP GLUT1- subset, and the former cells show enhanced chemotaxis to the CXCR4 ligand CXCL12. Thus, during human thymopoiesis, GLUT1 is up-regulated after beta-selection, and these immature DP cells constitute a population with distinct metabolic and chemotactic properties.


Figures

Fig. 1.
Fig. 1.
GLUT1 is expressed on a subpopulation of DP thymocytes characterized by high CD4 expression. (A) Surface expression of GLUT1 on freshly isolated human thymoctes was assessed by using an EGFP-tagged HRBD fusion protein that specifically binds GLUT1 (12). GLUT1 expression (solid line) is indicated relative to control staining. The relative expression of GLUT1 in DN, DP, SP4, and SP8 thymocyte subsets was determined by incubation of thymocytes with HRBDEGFP before staining with αCD4 and αCD8 mAbs. (B) The relative expression of CD4 and CD8 on GLUT1+ cells was monitored on CD4/CD8/GLUT1-stained total thymocytes. GLUT1+ cells were back-gated and superimposed (green) onto the total thymocyte population (black) on a CD4/CD8 dot plot. Results are representative of data obtained in five thymi.
Fig. 2.
Fig. 2.
GLUT1 expression on CD4hiDP thymocytes is of functional significance and promotes glucose uptake. (A) Total human thymocytes and DP and SP4 populations were FACS-sorted. DP cells were further sorted on the basis of CD4 expression, resulting in the isolation of CD4hiDP and CD4loDP subsets, as indicated in the dot plot. (B) Glucose uptake was assayed by incubating total and sorted thymocyte populations (6 × 10⁵) with 2-deoxy-d[1-3H]glucose (0.1 mM) for 45 min at 37°C. Uptake is expressed as mean cpm for triplicate samples; error bars indicate SD. Statistical significance comparing glucose uptake in CD4hiDP, total DP, and CD4loDP cells is indicated.
Fig. 3.
Fig. 3.
Characterization of CD4hiGLUT1+DP thymocytes.(A) The phenotype of CD4hiDP thymocytes was compared with that of CD4loDP and mature CD3+SP4 thymocytes. Cells were stained for CD4 and CD8 with GLUT1, TCRαβ, CD3, CD71, or CD8β mAbs. Representative histograms, showing relative expression levels in these three populations, are presented. (B) To precisely assess whether GLUT1 is expressed within β-selected cells, its expression in DP populations was analyzed within the CD8β- and CD8β+ subsets, as indicated in the histograms.
Fig. 4.
Fig. 4.
High CD4 expression characterizes a large cycling DP population. (A) The forward scatter (FSC) and side angle scatter (SSC) of CD4hiDP and CD4loDP thymocytes were analyzed by flow cytometry. (B) Cell-cycle entry of CD4hiDP and CD4loDP thymocytes was monitored by assessing intracellular expression of Ki-67. (C) DNA levels in CD4hiDP and CD4lloDP cells were monitored by 7-amino-actinomycin D (7-AAD) staining, and the relative percentages of thymocytes in S/G2/M are indicated. Results are representative of data obtained in two thymi.
Fig. 5.
Fig. 5.
High expression of the HIV-1 coreceptor CXCR4 is largely restricted to GLUT1+CD4hiDP thymocytes. (A) CXCR4 expression was assessed on total thymocytes, and, based on the level of staining, thymocytes were subdivided into CXCR4-/lo, CXCR4int, and CXCR4hi populations, as indicated. The maturation state of these populations was determined by assessing the expression of CD4 and CD8 surface markers. The various CXCR4 subsets were back-gated and superimposed (green) onto the total thymocyte population (black) on a CD4/CD8 dot plot. (B) Expression of GLUT1, TCRαβ, CD71, and Ki-67 markers, with respect to CXCR4, were monitored on the CD4hiDP and CD4loDP cells and are presented as dot plots. The percentages of cells in each quadrant are indicated, and the quadrants were drawn with respect to high, rather than positive, CXCR4 expression (MFI of CXCR4 staining varies because of the use of different αCXCR4 fluorochoromes). The percentages of CXCR4hi cells expressing these various markers are indicated in parentheses.
Fig. 6.
Fig. 6.
High levels of CXCR4 on CD4hiGLUT1+DP thymocytes are associated with enhanced CXCL12-induced migration. Migration of thymocyte populations in response to the CXCR4 ligand CXCL12 (300 ng/ml) was analyzed in an in vitro migration assay using total unsorted thymocytes. To assess the relative migration of the CXCR4hiGLUT1+DP population in comparison with other DP and SP subsets, the former DP cells were identified on the basis of low TCRαβ levels and high CD71 expression (TCRαβlo/CD71+), because CXCR4 and GLUT1 levels can be modulated by ex vivo culture and by the presence of chemokine. The chemotactic index, defined by the ratio of cells migrating to CXCL12 relative to medium alone, was determined a posteriori by CD4/CD8/TCRαβ/CD71 phenotype analyses of the cells that had migrated. The mean of duplicate samples (±SD) is presented. Statistical differences between the TCRαβlo/CD71+DP population and other thymocyte subsets are indicated.

References

    1. Mueckler, M., Caruso, C., Baldwin, S. A., Panico, M., Blench, I., Morris, H. R., Allard, W. J., Lienhard, G. E. & Lodish, H. F. (1985) Science 229, 941-945. - PubMed
    1. Chakrabarti, R., Jung, C. Y., Lee, T. P., Liu, H. & Mookerjee, B. K. (1994) J. Immunol. 152, 2660-2668. - PubMed
    1. Rathmell, J. C., Elstrom, R. L., Cinalli, R. M. & Thompson, C. B. (2003) Eur. J. Immunol. 33, 2223-2232. - PubMed
    1. Frauwirth, K. A., Riley, J. L., Harris, M. H., Parry, R. V., Rathmell, J. C., Plas, D. R., Elstrom, R. L., June, C. H. & Thompson, C. B. (2002) Immunity 16, 769-777. - PubMed
    1. Cooper, E. H., Barkhan, P. & Hale, A. J. (1963) Br. J. Haematol. 9, 101-111. - PubMed

Publication types

MeSH terms