. 2005 Sep;167(3):733-47.
doi: 10.1016/S0002-9440(10)62047-0.

Activin controls skin morphogenesis and wound repair predominantly via stromal cells and in a concentration-dependent manner via keratinocytes

Affiliations

Activin controls skin morphogenesis and wound repair predominantly via stromal cells and in a concentration-dependent manner via keratinocytes

Casimir Bamberger et al. Am J Pathol. 2005 Sep.

Abstract

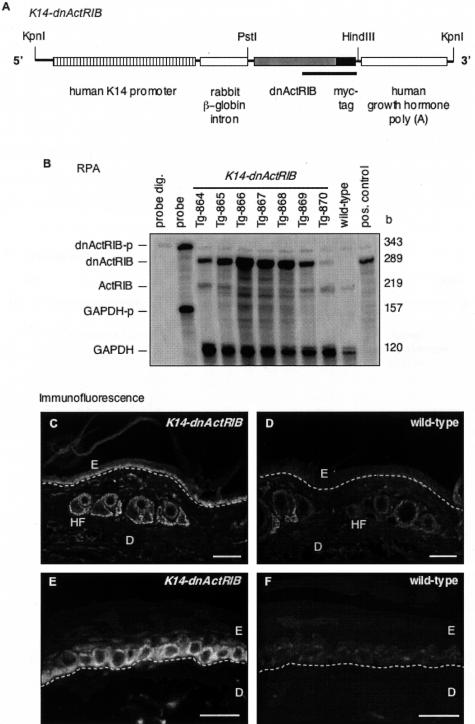
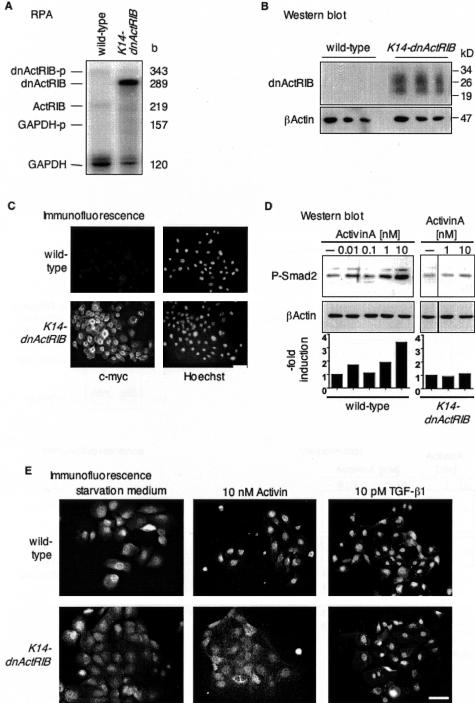
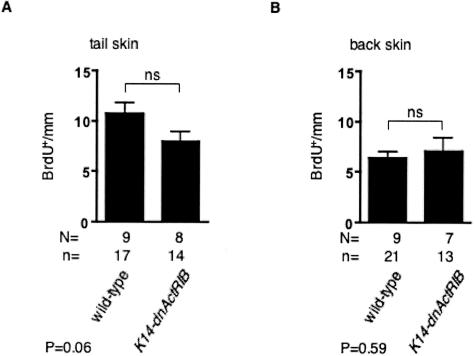
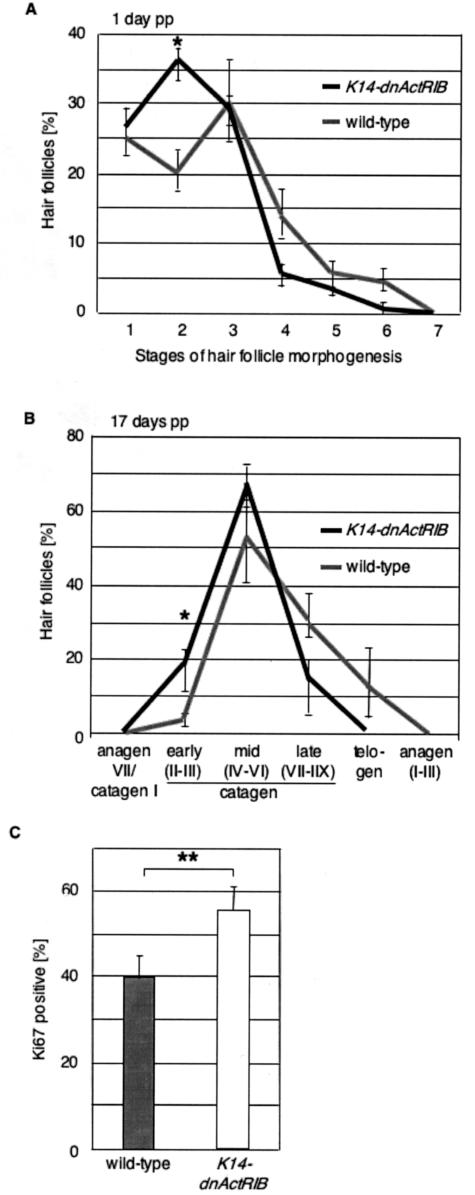
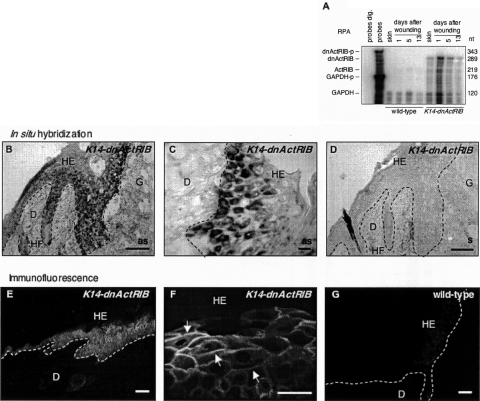
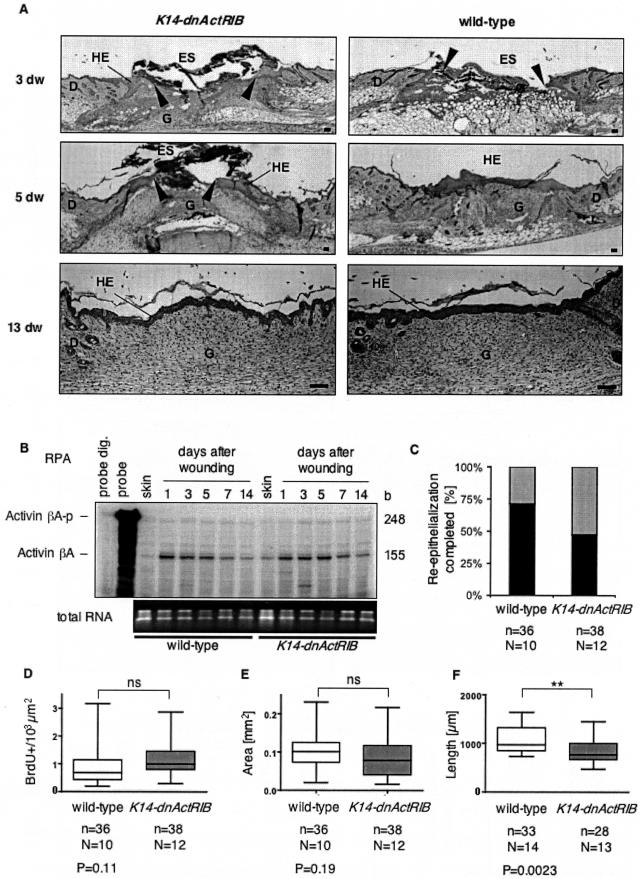
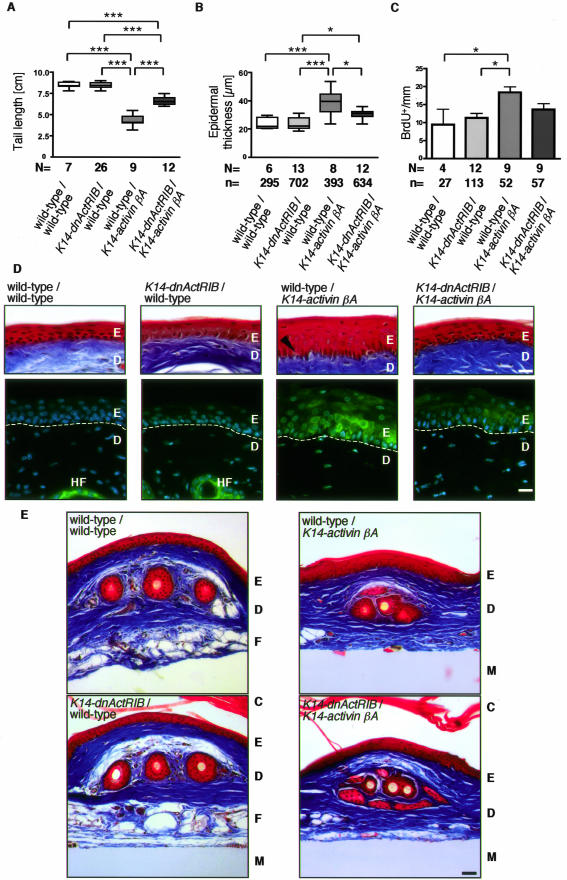
The transforming growth factor-beta family member activin is a potent regulator of skin morphogenesis and repair. Transgenic mice overexpressing activin in keratinocytes display epidermal hyper-thickening and dermal fibrosis in normal skin and enhanced granulation tissue formation after wounding. Mice overexpressing the secreted activin antagonist follistatin, however, have the opposite wound-healing phenotype. To determine whether activin affects skin morphogenesis and repair via activation of keratinocytes and/or stromal cells, we generated transgenic mice expressing a dominant-negative activin receptor IB mutant (dnActRIB) in keratinocytes. The architecture of adult skin was unaltered in these mice, but delays were observed in postnatal pelage hair follicle morphogenesis and in the first catagen-telogen transformation of hair follicles. Although dnActRIB-transgenic mice showed slightly delayed wound re-epithelialization after skin injury, the strong inhibition of granulation tissue formation seen in follistatin-transgenic mice was not observed. Therefore, although endogenous activin appeared to affect skin morphogenesis and repair predominantly via stromal cells, overexpressed activin strongly affected the epidermis. The epidermal phenotype of activin-overexpressing mice was partially rescued by breeding these animals with dnActRIB-transgenic mice. These results demonstrate that activin affects both stromal cells and keratinocytes in normal and wounded skin and that the effect on keratinocytes is dose-dependent in vivo.


Figures

Figure 1
Figure 1
Generation of transgenic mice expressing a dominant-negative ActRIB mutant in the epidermis. A: Schematic representation of the K14-dnActRIB transgene. The construct includes a human keratin 14 promoter, a rabbit β-globin intron, the dnActRIB cDNA in-frame with a c-Myc epitope cDNA, and a transcription termination/polyadenylation sequence of the human growth hormone gene. The underlined region indicates the DNA sequence of the riboprobe used for RPA. B: Twenty μg of total RNA isolated from tail skin of wild-type and transgenic (K14-dnActRIB) mice of different lines were analyzed by RPA for the presence of endogenous ActRIB or transgene-derived dnActRIB mRNA. The same samples were additionally hybridized with a glyceraldehyde-3-phosphate dehydrogenase riboprobe (GAPDH-p) as a loading control. Ten ng of the plasmid DNA harboring the dnActRIB cDNA sequence served as a positive control. The full-length riboprobes were loaded in the lane labeled “probe” and used as a size marker. Riboprobes after digestion with RNases A and T1 were loaded in the lane labeled “probe dig.” Frozen sections from tail skin of K14-dnActRIB transgenic (C, E) and wild-type (D, F) mice were analyzed by immunofluorescence using an antibody directed against the c-Myc epitope. A white dotted line indicates the location of the basement membrane. D, dermis; E, epidermis; HF, hair follicle. Scale bars: 100 μm (C, D); 50 μm (E, F).
Figure 2
Figure 2
Inhibition of activin receptor signaling in primary keratinocytes from K14-dnActRIB transgenic mice. A: Five μg of total RNA isolated from cultured murine keratinocytes were analyzed for the expression of the endogenous ActRIB and transgene-derived dnActRIB mRNA by RPA. B: Western blotting of 20 μg of protein of different cell lysates from keratinocytes of wild-type and transgenic mice was performed to identify the dnActRIB protein. The membrane was incubated with a monoclonal antibody directed against the c-Myc epitope and reprobed with an antibody directed against β-actin as a loading control. C: Cultured primary murine keratinocytes were analyzed for the presence of the dnActRIB protein. After fixation and permeabilization, the c-Myc tag was detected with an antibody directed against c-Myc, and nuclei were visualized with Hoechst 33258. After a 24-hour starvation period, murine keratinocytes in primary cell culture were treated for 60 minutes (D) or 2.5 hours (E) with different concentrations of human activin A or TGF-β1 as indicated. D: Phosphorylated Smad2 proteins were detected by Western blotting. The membrane was reprobed with an antibody directed against cytoplasmic β-actin as a loading control. The induction in the levels of phosphorylated Smad2 relative to control is represented in a bar graph below the blot. The amount of phosphorylated Smad2 was normalized to β-actin at each individual time point. E: Activin A- or TGF-β1-mediated nuclear translocation of Smad2/3 was monitored in murine keratinocytes from K14-dnActRIB or wild-type mice by immunofluorescence using a polyclonal antibody directed against Smad2/3. Scale bar, 50 μm.
Figure 3
Figure 3
Unaltered keratinocyte proliferation in the skin of K14-dnActRIB transgenic mice. The number of BrdU-positive keratinocytes in tail skin (A) or back skin (B) of K14-dnAcRIB transgenic and wild-type mice with a B6,D2 mixed background was determined per mm length of basement membrane. Error bars indicate SEM. The significance between two groups was determined by Student’s t-test. The determined P value is given below the corresponding bar graph. n, number of skin sections; N, number of animals.
Figure 4
Figure 4
Delayed hair follicle morphogenesis in K14-dnActRIB transgenic mice. A: Pelage hair follicles in the back skin of K14-dnActRIB transgenic and wild-type mice 1 day after birth were evaluated according to the hair follicle morphogenesis stages defined in Paus and colleagues. Higher values indicate later stages in the hair cycle, *P = 0.018. B: Pelage hair follicles were categorized at the end of the first hair cycle at day 17 pp. C: The percentage of Ki67-positive cells underneath the Auber’s line in pelage hair follicles was determined at day 17 pp. Error bars indicate standard errors of mean. The significance of the difference between wild-type and transgenic mice was determined by Student’s t-test. *P < 0.05, **P < 0.01; P values determined with analysis of variance test.
Figure 5
Figure 5
dnActRIB is highly expressed in full-thickness skin wounds. A: Twenty-μg samples of total cellular RNA from normal and wounded skin of different stages from wild-type mice and transgenic animals (line Tg-868) were analyzed for the presence of dnActRIB mRNA by RPA. Hybridization with a GAPDH riboprobe served as a loading control. A low amount of the riboprobes was loaded in the lane labeled “probes” and used as a size marker. Riboprobes digested with RNases A and T1 were loaded in the lane labeled “probes dig.” B–D: Frozen sections from day 5 wounds of K14-dnActRIB transgenic mice were analyzed by nonradioactive in situ hybridization for the presence of dnActRIB mRNA. An overview over one half of a wound is shown in B. Note the strong expression of the transgene in basal and suprabasal layers of the hyperproliferative epithelium. A higher magnification of an independent section is shown in C. D: A section adjacent to the one shown in B was hybridized with the sense riboprobe. E–G: Cryosections of day 5 wounds from K14-dnActRIB transgenic (E, F) and wild-type (G) mice were analyzed by immunofluorescence using an antibody directed against the c-Myc epitope. A strong signal was detected in basal and suprabasal keratinocytes of the wound epidermis of K14-dnActRIB transgenic mice. A higher magnification (F, arrows) revealed membrane-associated localization of dnActRIB. The weak staining observed in wound epidermis of wild-type mice most likely results from the endogenous c-Myc protein. as, anti-sense; D, dermis; HE, hyperproliferative wound epidermis; HF, hair follicle; G, granulation tissue; s, sense. Scale bars: 100 μm (B, D, E, G); 50 μm (C, F).
Figure 6
Figure 6
Wound healing in K14-dnActRIB transgenic mice. A: H&E-stained sections of paraffin-embedded back skin wounds at days 3, 5, and 13 after injury, are shown. Arrowheads indicate the position of the tip of the hyperproliferative epithelium. B: Forty-μg samples of total cellular RNA from normal skin and skin wounds of different stages from wild-type and K14-dnActRIB transgenic mice were analyzed for the presence of activinβA mRNA by RPA. One μg of the RNAs was loaded on a 1.5% agarose gel and stained with ethidium bromide as a control (bottom). C: The bar graph shows the percentage of day 5 wounds, which were completely re-epithelialized in K14-dnActRIB transgenic and wild-type mice (black bars). Quantitative analysis of the wound-healing process: box plots show the results obtained for the number of BrdU+ cells per area (103 μm2) in the hyperproliferative epithelium (D), the absolute area of the hyperproliferative epithelium (E), and the length of the wound epidermis (F). Shown are median values, 25th to 75th percentile (boxes), and range (vertical bars). The number of wound halves (n) analyzed from a total number (N) of mice and the P value determined by the Students’ t-test is indicated underneath each diagram (*P < 0.05, **P < 0.01, ***P < 0.001). D, dermis; dw, days wounded; ES, eschar; G, granulation tissue; HE, hyperproliferative epithelium. Scale bars, 100 μm (A).
Figure 7
Figure 7
dnActRIB reduces the K14-activinβA-induced phenotype. A: The tail-length of wild-type mice and mice single or double transgenic for K14-dnActRIB and K14-activinβA was determined (N, number of mice investigated). B: The thickness of the epidermis was measured in orthokeratotic regions of the tail. The epidermal hyperthickening in activin-overexpressing mice is partially rescued by dnActRIB (N, number of mice; n, number of measurements performed in different areas of the tails). C: BrdU incorporation studies revealed the number of proliferating keratinocytes per mm of tail epidermis. Note the hyperproliferation of basal keratinocytes in activin-overexpressing mice and the almost complete rescue by dnActRIB. The significance was determined using the Bonferroni correction (A–C), eg, *P < 0.05 and ***P < 0.001 (N, number of mice; n, number of measurements performed in different areas of the tails). The epidermis of Masson trichrome-stained tail skin from wild-type, single-transgenic, and double-transgenic mice is shown at high magnification in D. Note the enlarged spinous layer in K14-activinβA mice when compared to K14-dnActRIB transgenic or wild-type mice. The arrow points to densely packed keratinocytes in activin βA-overexpressing single-transgenic mice. Immunohistochemistry localized keratin 6 expression, visualized as Cy2 (green) fluorescence in keratinocytes of the interfollicular epidermis. Cell nuclei are stained with Hoechst 33258 (blue). The staining shows presence of keratin 6 in the epidermis of K14-activinβA transgenic mice, its reduced expression in K14-dnActRIB/K14-activinβA double-transgenic mice, and the lack of keratin 6 expression in interfollicular epidermis of wild-type and K14-dnActRIB transgenic mice. Dotted line: basal lamina. E: Sections from tail skin of wild-type, single- and double-transgenic mice were stained by Masson/Trichrome. Fatty tissue is replaced by connective tissue in both K14-activinβA and in K14-dnActRIB/K14-activinβA transgenic mice. Abbreviations: C, cornified layer; D, dermis; E, epidermis; F, fatty tissue; HF, hair follicle; M, nitrocellulose membrane. Scale bars: 50 μm (D); 10 μm (E).

References

    1. Lin SY, Morrison JR, Phillips DJ, de Kretser DM. Regulation of ovarian function by the TGF-beta superfamily and follistatin. Reproduction. 2003;126:133–148. - PubMed
    1. Kerszberg M, Wolpert L. Mechanisms for positional signalling by morphogen transport: a theoretical study. J Theor Biol. 1998;191:103–114. - PubMed
    1. Shimizu K, Gurdon JB. A quantitative analysis of signal transduction from activin receptor to nucleus and its relevance to morphogen gradient interpretation. Proc Natl Acad Sci USA. 1999;96:6791–6796. - PMC - PubMed
    1. Dyson S, Gurdon JB. The interpretation of position in a morphogen gradient as revealed by occupancy of activin receptors. Cell. 1998;93:557–568. - PubMed
    1. Phillips DJ. Regulation of activin’s access to the cell: why is mother nature such a control freak? Bioessays. 2000;22:689–696. - PubMed

Publication types

MeSH terms