. 2005 Sep 7;11(33):5142-50.
doi: 10.3748/wjg.v11.i33.5142.

Trans-10,cis-12, not cis-9,trans-11, conjugated linoleic acid decreases ErbB3 expression in HT-29 human colon cancer cells

Affiliations

Trans-10,cis-12, not cis-9,trans-11, conjugated linoleic acid decreases ErbB3 expression in HT-29 human colon cancer cells

Han Jin Cho et al. World J Gastroenterol. .

Abstract

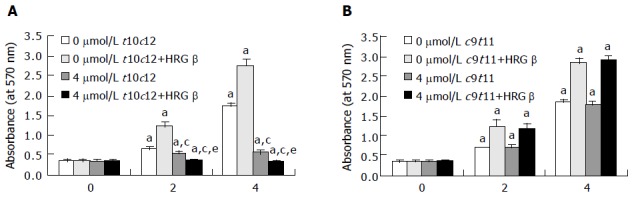
Aim: To examine whether trans-10,cis-12 CLA (t10c12) or cis-9,trans-11 CLA (c9t11) inhibits heregulin (HRG)-beta-stimulated cell growth and HRG-beta-ErbB3 signaling in HT-29 cells.

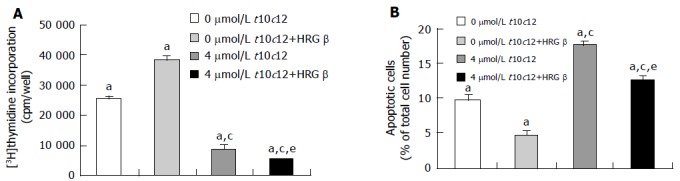
Methods: We cultured HT-29 cells in the absence or presence of the CLA isomers and/or the ErbB3 ligand HRG-beta. MTT assay, [3H]thymidine incorporation, Annexin V staining, RT-PCR, Western blotting, immunoprecipitation, and in vitro kinase assay were performed.

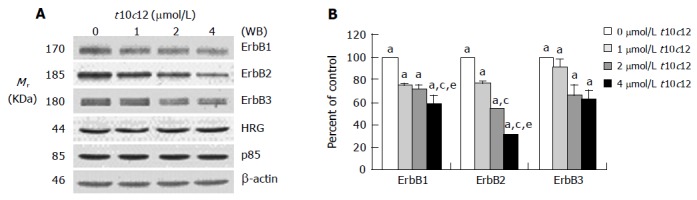
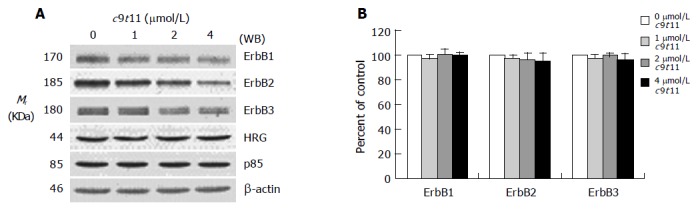
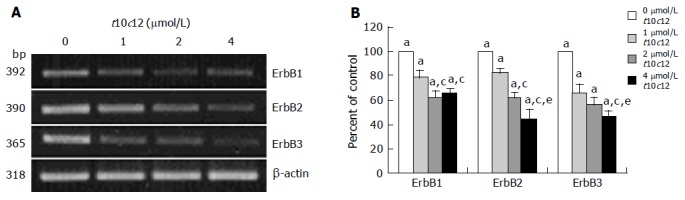
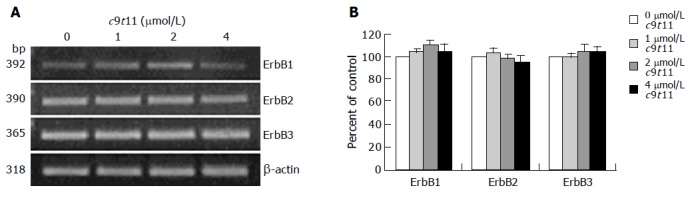
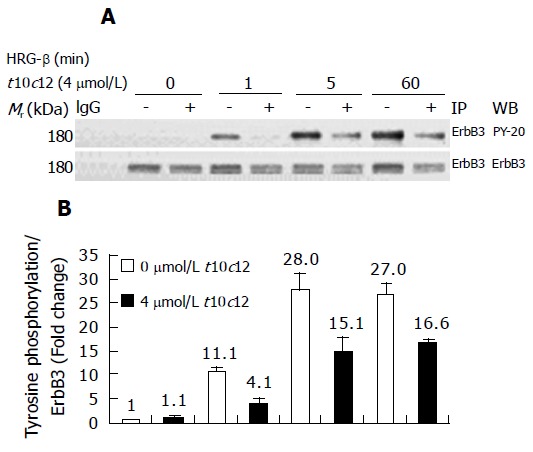
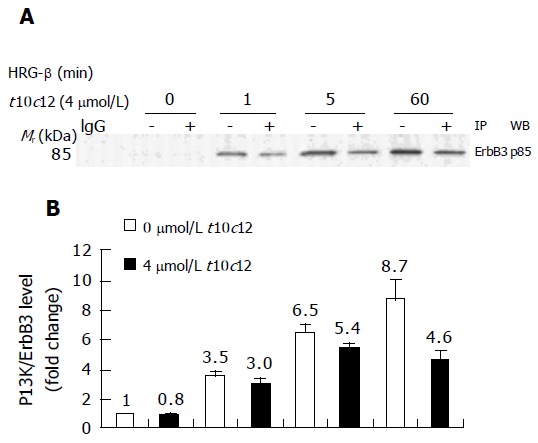
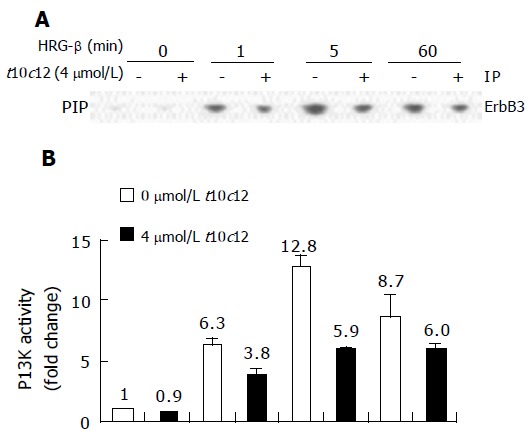
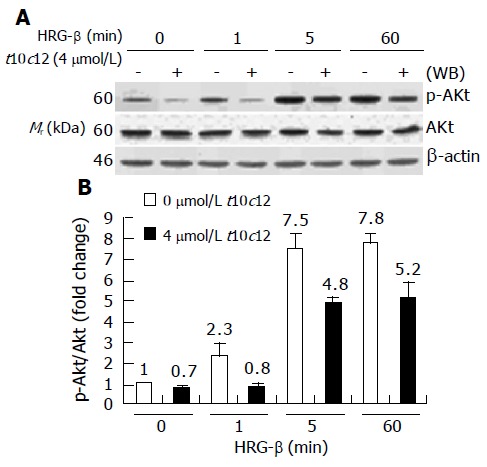
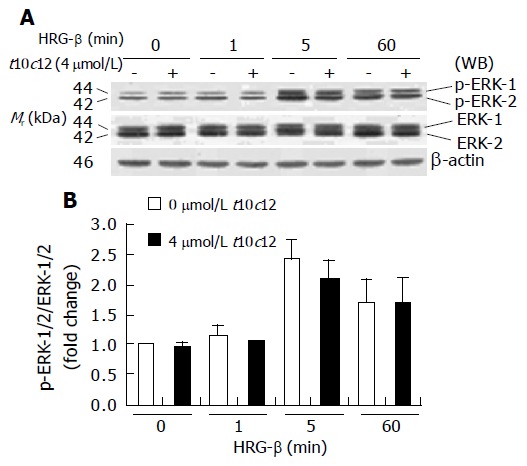
Results: HRG-beta increased cell growth, but did not prevent t10c12-induced growth inhibition. T10c12 inhibited DNA synthesis and induced apoptosis of HT-29 cells, whereas c9t11 had no effect. T10c12 decreased the levels of ErbB1, ErbB2, and ErbB3 proteins and transcripts in a dose-dependent manner, whereas c9t11 had no effect. Immunoprecipitation/Western blot studies revealed that t10c12 inhibited HRG-beta-stimulated phosphorylation of ErbB3, recruitment of the p85 subunit of phosphoinositide 3-kinase (PI3K) to ErbB3, ErbB3-associated PI3K activities, and phosphorylation of Akt. However, c9t11 had no effect on phospho Akt levels. Neither t10c12 nor c9t11 had any effect on HRG-beta-induced phosphorylation of ERK-1/2.

Conclusion: These results indicate that the inhibition of HT-29 cell growth by t10c12 may be induced via its modulation of ErbB3 signaling leading to inhibition of Akt activation.


Figures

Figure 1
Figure 1
Trans-10,cis-12 (t10c12) CLA abrogates the growth stimulatory effect of heregulin (HRG )-β. HT-29 cells were plated in 24-well plates at 50000 cells/well in DMEM/F12 supplemented with 10% fetal bovine serum. A day later, the monolayers were serum-starved with serum-free DMEM/F12 supplemented with 5 μg/mL transferrin, 0.1 mg/mL BSA, and 5 ng/mL selenium for 24 h. After serum-starvation, cells were incubated in serum-free medium in the absence or presence of 4 μmol/L t10c12 (A) or c9t11 (B) with or without 20 ng/mL HRG-β. Cell numbers were estimated by the MTT assay. Each bar represents the mean±SE (n = 6). Comparisons between groups that yielded significant differences are indicated by different letters above each bar. For example, aP<0.05 vs 0 μmol/L t10c12, cP<0.05 vs 0 μmol/L t10c12 + HRGβ, eP<0.05 vs 4 μmol/L t10c12.
Figure 2
Figure 2
Effect of HRG-β and/or t10c12 on DNA synthesis and apoptosis of HT-29 cells. HT-29 cells were cultured and treated with 4 μmol/L t10c12 in the absence or presence of 20 ng/mL HRG-β. A: To estimate DNA synthesis, [3H]thymidine incorporation into DNA was measured. B: To measure apoptosis, the cells were stained with 7-amino-actinomycin D (7-AAD) and Annexin V, and then analyzed by flow cytometry. The number of early apoptotic cells is expressed as a percentage of total cell number. Each bar represents the mean±SE from six independent experiments. Comparisons between groups that yielded significant differences are indicated by different letters above each bar. For example, aP<0.05 vs 0 μmol/L t10c12, cP<0.05 vs 0 μmol/L t10c12 + HRGβ, eP<0.05 vs 4 μmol/L t10c12.
Figure 3
Figure 3
Effect of t10c12 on the protein expression of ErbB1, ErbB2, ErbB3, HRG, and the p85 subunit of PI3K. HT-29 cells were treated with various concentrations of t10c12 for 3 d. Cell lysates were subjected to immunoblotting with an antibody against ErbB1, ErbB2, ErbB3, p85 subunit of PI3K, HRG, or β-actin. A: Photographs of chemiluminescent detection of the blots, which were representative of three independent experiments, are shown; B: Quantitative analysis of immunoblots. The relative abundance of each band was estimated by densitometric scanning of the exposed films. Each bar represents the mean±SE (n = 3). Comparisons between groups that yielded significant differences are indicated by different letters above each bar. For example, aP<0.05 vs 0 μmol/L t10c12, cP<0.05 vs 1 μmol/L t10c12, eP<0.05 vs 2 μmol/L t10c12.
Figure 4
Figure 4
Effect of c9t11 on the protein expression of ErbB1, ErbB2, ErbB3, HRG, and the p85 subunit of PI3K. HT-29 cells were treated with various concentrations of c9t11 for 3 d. Cell lysates were subjected to immunoblotting with an antibody against ErbB1, ErbB2, ErbB3, p85 subunit of PI3K, HRG, or β-actin. A: Photographs of chemiluminescent detection of the blots, which were representative of three independent experiments, are shown. B: Quantitative analysis of immunoblots. The relative abundance of each band was estimated by densitometric scanning of the exposed films. Each bar represents the mean±SE (n = 3).
Figure 5
Figure 5
Effect of t10c12 on ErbB1, ErbB2, and ErbB3 transcripts. HT-29 cells were treated with various concentrations of t10c12 for 3 d. Total RNA was isolated and RT-PCR was performed as described in Materials and methods. A: Photographs of the ethidium bromide-stained gel, which were representative of three independent experiments, are shown; B: Quantitative analysis of mRNAs. The relative abundance of each band was estimated by densitometric scanning of the exposed films. Each bar represents the mean±SE (n = 3). Comparisons between groups that yielded significant differences are indicated by different letters above each bar. For example, aP<0.05 vs 0 μmol/L t10c12, cP<0.05 vs 1 μmol/L t10c12, eP<0.05 vs 2 μmol/L t10c12.
Figure 6
Figure 6
Effect of c9t11 on ErbB1, ErbB2, and ErbB3 transcripts. HT-29 cells were treated with various concentrations of c9t11. Total RNA was isolated and RT-PCR was performed as described in Materials and methods. A: Photographs of the ethidium bromide-stained gel, which were representative of three independent experiments, are shown; B: Quantitative analysis of mRNAs. The relative abundance of each band was estimated by densitometric scanning of the exposed films. Each bar represents the mean±SE (n = 3).
Figure 7
Figure 7
Effect of t10c12 on HRG-β-induced tyrosine phosphorylation of ErbB3 in HT-29 cells. Cells were treated in the absence or presence of 4 μmol/L t10c12 for 3 d and lysed without stimulation (0) or after 1, 5, or 60 min of stimulation with HRG-β. Cell lysates were incubated with an anti-ErbB3 antibody and the immune complexes were precipitated with protein A-Sepharose. The immunoprecipitated proteins were analyzed by Western blotting with antibodies against phosphotyrosine or ErbB3. A: Photographs of chemiluminescent detection of the blots, which were representative of three independent experiments, are shown; B: The relative abundance of each band was estimated by densitometric scanning of the exposed films. Each bar represents the mean±SE (n = 3).
Figure 8
Figure 8
Effect of t10c12 on HRG-β-induced recruitment of the p85 subunit of PI3K to ErbB3 in HT-29 cells. Immunoprecipitation was performed with an anti-ErbB3 antibody and protein A-Sepharose as described above. The immunoprecipitated proteins were analyzed by Western blotting with an antibody against the p85 PI3K subunit. A: A photograph of chemiluminescent detection of the blot, which was representative of three independent experiments, is shown. B: The relative fold change in p85 to its own ErbB3 band on Western blots. Each bar represents the mean±SE (n = 3).
Figure 9
Figure 9
Effect of t10c12 and/or HRG-β on ErbB3-associated PI3K activity. Cells were treated, and lysates were prepared and immunoprecipitated with an anti-ErbB3 antibody as described in Figure 8. The immune complexes were incubated with phosphatidylinositol and [g-32P]ATP. Phosphatidylinositol 3-phosphate (PIP) generated by immunoprecipitated PI3K was separated by thin-layer chromatography (TLC). A: An autoradiograph of the TLC plate, which was representative of three independent experiments, is shown; B: Relative fold changes in PIP. The radioactive PIP signals were quantitated by densitometry. Each bar represents the mean±SE (n = 3).
Figure 10
Figure 10
Effect of t10c12 on HRG-β-induced Akt activation. Similar protein samples as those in Figure 8 were analyzed by immunoblotting with anti-phospho-Ser473 Akt (p-Akt) or whole Akt protein antibodies. A: Photographs of chemiluminescent detection of the blots, which were representative of three independent experiments, are shown; B: Quantitative analysis of immunoblots. The relative fold change in p-Akt to its own Akt control band on Western blots was quantitated by densitometric analysis. Each bar represents the mean±SE (n = 3).
Figure 11
Figure 11
Effect of t10c12 on HRG-β-induced ERK-1/2 activation in HT-29 cells. Similar protein samples as those in Figure 8 were analyzed by immunoblotting with p-ERK-1/2 or whole ERK-1/2 antibodies. A: Photographs of chemiluminescent detection of the blots, which were representative of three independent experiments, are shown; B: Quantitative analysis of immunoblots. The relative fold change in p-ERK-1/2 to its own ERK-1/2 control band on Western blots was quantitated by densitometric analysis. Each bar represents the mean±SE (n = 3).

References

    1. Belury MA. Inhibition of carcinogenesis by conjugated linoleic acid: potential mechanisms of action. J Nutr. 2002;132:2995–2998. - PubMed
    1. Park HS, Ryu JH, Ha YL, Park JH. Dietary conjugated linoleic acid (CLA) induces apoptosis of colonic mucosa in 1,2-dimethylhydrazine-treated rats: a possible mechanism of the anticarcinogenic effect by CLA. Br J Nutr. 2001;86:549–555. - PubMed
    1. Park HS, Cho HY, Ha YL, Park JH. Dietary conjugated linoleic acid increases the mRNA ratio of Bax/Bcl-2 in the colonic mucosa of rats. J Nutr Biochem. 2004;15:229–235. - PubMed
    1. O'Shea M, Stanton C, Devery R. Antioxidant enzyme defence responses of human MCF-7 and SW480 cancer cells to conjugated linoleic acid. Anticancer Res. 1999;19:1953–1959. - PubMed
    1. Palombo JD, Ganguly A, Bistrian BR, Menard MP. The antiproliferative effects of biologically active isomers of conjugated linoleic acid on human colorectal and prostatic cancer cells. Cancer Lett. 2002;177:163–172. - PubMed

Publication types

MeSH terms

Substances