Assembly of b/HLH/z proteins c-Myc, Max, and Mad1 with cognate DNA: importance of protein-protein and protein-DNA interactions
- PMID: 16128587
- PMCID: PMC3225066
- DOI: 10.1021/bi050206i
Assembly of b/HLH/z proteins c-Myc, Max, and Mad1 with cognate DNA: importance of protein-protein and protein-DNA interactions
Abstract
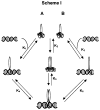
Among the best characterized of the transcription factors are the b/HLH/z proteins: USF, Max, Myc, and Mad. These proteins bind to the DNA E-box, a six base pair sequence, CACGTG. Max and Myc form a heterodimer that has strong oncogenic potential but can also repress transcription, while Mad and Max form a heterodimer that acts as a transcription repressor. We have used fluorescence anisotropy to measure protein-protein and protein-DNA affinity. The specific binding between MLP DNA and Max (K = 2.2 +/- 0.5 nM) is about 10-fold higher affinity than LCR DNA and about 100-fold higher than for a nonspecific DNA. USF has a similar binding affinity as Max to MLP DNA (K = 15 +/- 10 nM), but Max binds more tightly to LCR and nonspecific DNA. A series of oligonucleotides designated E-box, half-E-box, and non-E-box were constructed to examine the effects of DNA sequence. The binding results indicate that for Max protein most of the binding energy can be attributed to individual elements with little cooperativity among the two halves of the E-box. Further studies measured the equilibria for the entire thermodynamic cycle of monomer-dimer-DNA interactions. Surprisingly, the affinity of the Max monomer-DNA for the second monomer was greatly reduced (K for the first monomer in the nanomolar range and for the second monomer in the micromolar range). Looked at from the perspective of the Max protein, the binding of DNA to Max significantly reduces the affinity of the Max protein for the second monomer, whether the second monomer is Myc, Mad, or Max. These data suggest the importance of protein-protein interactions in assembly of a transcription initiation complex.
Figures


Similar articles
-
Thermodynamics of protein-protein interactions of cMyc, Max, and Mad: effect of polyions on protein dimerization.Biochemistry. 2006 Feb 21;45(7):2333-8. doi: 10.1021/bi0522551. Biochemistry. 2006. PMID: 16475822 Free PMC article.
-
Kinetic analysis of the interaction of b/HLH/Z transcription factors Myc, Max, and Mad with cognate DNA.Biochemistry. 2010 Mar 30;49(12):2627-35. doi: 10.1021/bi901913a. Biochemistry. 2010. PMID: 20170194 Free PMC article.
-
X-ray structures of Myc-Max and Mad-Max recognizing DNA. Molecular bases of regulation by proto-oncogenic transcription factors.Cell. 2003 Jan 24;112(2):193-205. doi: 10.1016/s0092-8674(02)01284-9. Cell. 2003. PMID: 12553908
-
Myc-Max-Mad: a transcription factor network controlling cell cycle progression, differentiation and death.Curr Opin Genet Dev. 1994 Feb;4(1):102-8. doi: 10.1016/0959-437x(94)90098-1. Curr Opin Genet Dev. 1994. PMID: 8193530 Review.
-
Structural aspects of interactions within the Myc/Max/Mad network.Curr Top Microbiol Immunol. 2006;302:123-43. doi: 10.1007/3-540-32952-8_5. Curr Top Microbiol Immunol. 2006. PMID: 16620027 Review.
Cited by
-
NMR-identification of the interaction between BRCA1 and the intrinsically disordered monomer of the Myc-associated factor X.Protein Sci. 2024 Jan;33(1):e4849. doi: 10.1002/pro.4849. Protein Sci. 2024. PMID: 38037490 Free PMC article.
-
Biophysical and Structural Methods to Study the bHLHZip Region of Human c-MYC.Methods Mol Biol. 2021;2318:21-43. doi: 10.1007/978-1-0716-1476-1_3. Methods Mol Biol. 2021. PMID: 34019285
-
Enabling Peptide Ligation at Aromatic Junction Mimics via Native Chemical Ligation and Palladium-Mediated S-Arylation.Org Lett. 2023 Jun 30;25(25):4715-4719. doi: 10.1021/acs.orglett.3c01652. Epub 2023 Jun 15. Org Lett. 2023. PMID: 37318270 Free PMC article.
-
Structural and Biophysical Insights into the Function of the Intrinsically Disordered Myc Oncoprotein.Cells. 2020 Apr 22;9(4):1038. doi: 10.3390/cells9041038. Cells. 2020. PMID: 32331235 Free PMC article. Review.
-
Thermodynamics of protein-protein interactions of cMyc, Max, and Mad: effect of polyions on protein dimerization.Biochemistry. 2006 Feb 21;45(7):2333-8. doi: 10.1021/bi0522551. Biochemistry. 2006. PMID: 16475822 Free PMC article.
References
Publication types
MeSH terms
Substances
Grants and funding
LinkOut - more resources
Full Text Sources
Other Literature Sources

