. 2005 Sep 6;112(10):1384-91.
doi: 10.1161/CIRCULATIONAHA.105.543306. Epub 2005 Aug 29.

Subunit interaction determines IKs participation in cardiac repolarization and repolarization reserve

Affiliations

Subunit interaction determines IKs participation in cardiac repolarization and repolarization reserve

Jonathan Silva et al. Circulation. .

Erratum in

  • Circulation. 2009 Sep 8;120(10):e84

Abstract

Background: The role of IKs, the slow delayed rectifier K+ current, in cardiac ventricular repolarization has been a subject of debate.

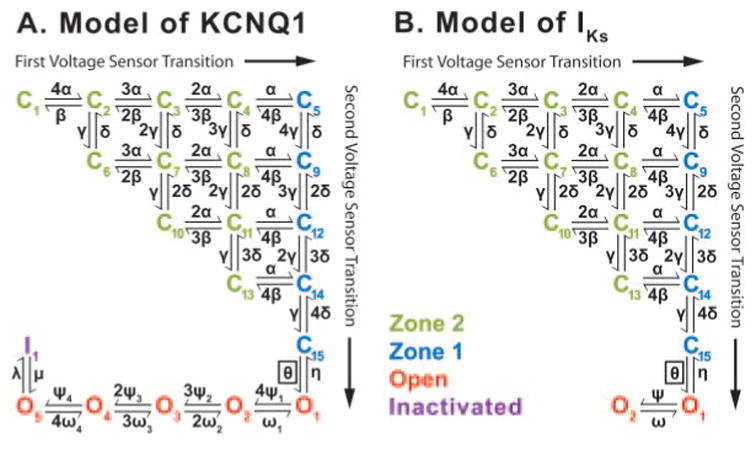
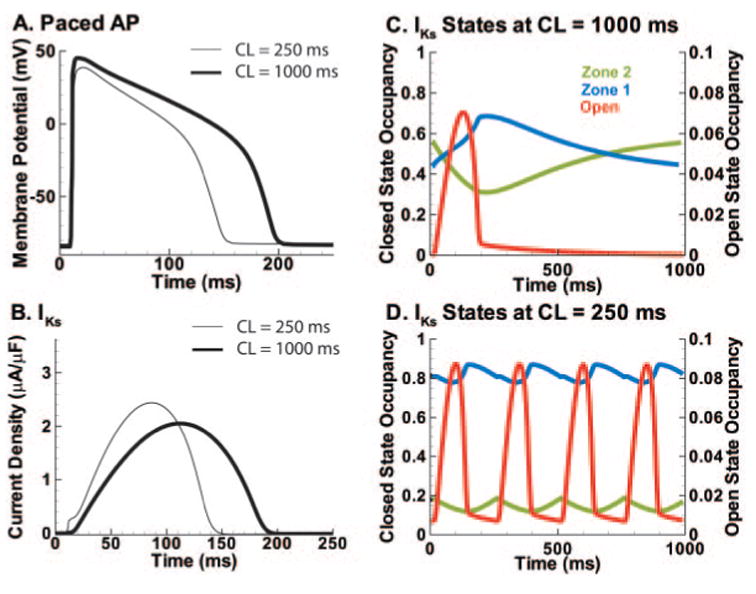
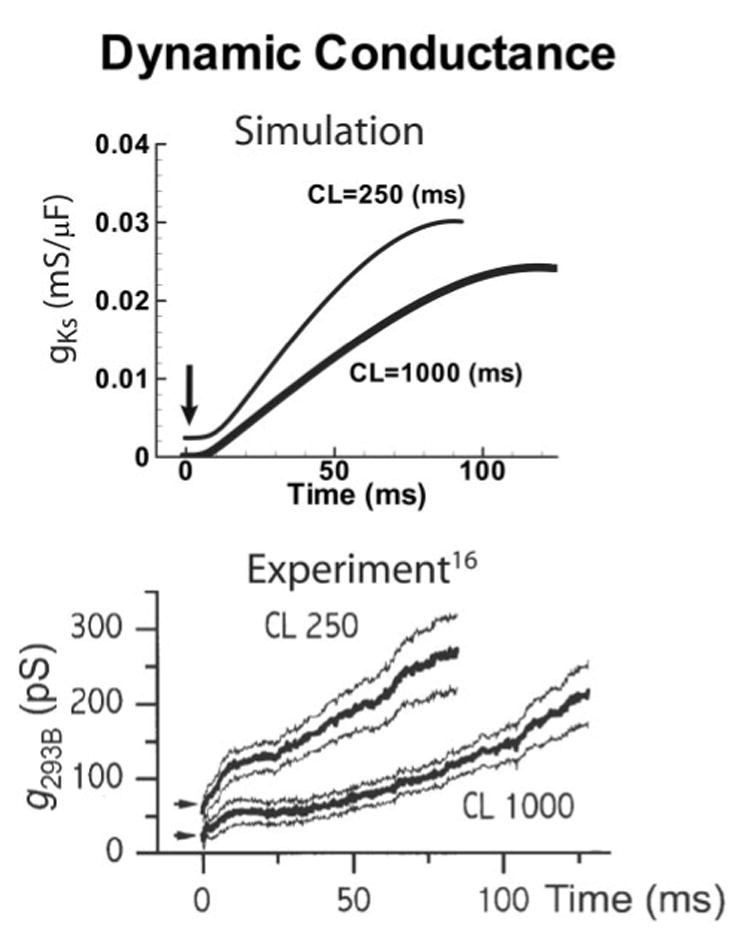
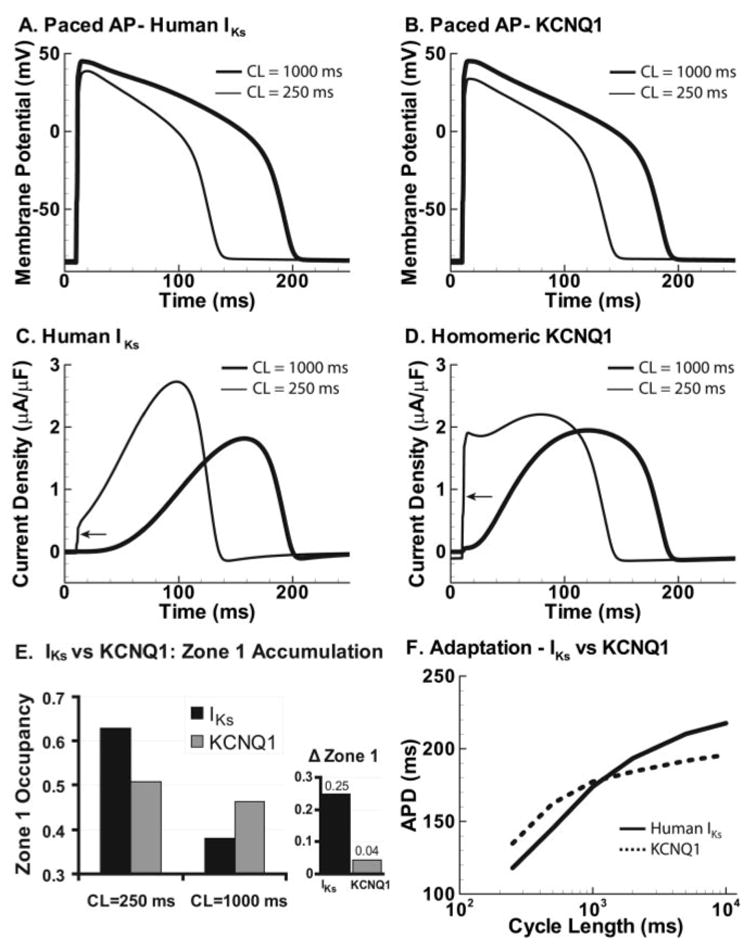
Methods and results: We develop a detailed Markov model of IKs and its alpha-subunit KCNQ1 and examine their kinetic properties during the cardiac ventricular action potential at different rates. We observe that interaction between KCNQ1 and KCNE1 (the beta-subunit) confers kinetic properties on IKs that make it suitable for participation in action potential repolarization and its adaptation to rate changes; in particular, the channel develops an available reserve of closed states near the open state that can open rapidly on demand.

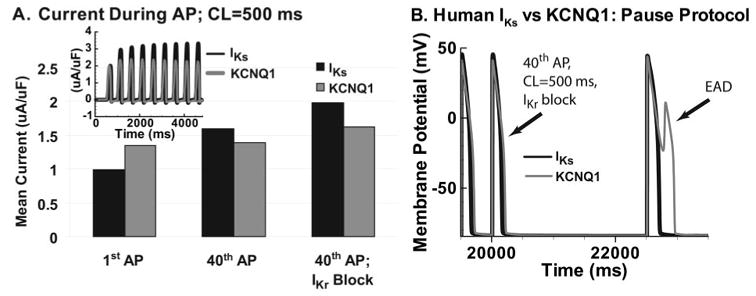
Conclusions: Because of its ability to form an available reserve, IKs can function as a repolarization reserve when IKr, the rapid delayed rectifier, is reduced by disease or drug and can prevent excessive action potential prolongation and development of arrhythmogenic early afterdepolarizations.


Figures

Figure 1
Figure 1
KCNQ1 and IKs Markov models. A, Model of KCNQ1 contains 15 closed (C1 to C15) states to account for 2 transitions of each of the 4 voltage sensors before channel opening. Green closed states represent channels in zone 2 that have not completed the first transition for all 4 channel subunits. Blue closed states represent channels in zone 1 that have completed 4 first voltage sensor transitions. The boxed transition (θ) to the open state is voltage independent. There are 5 open states (O1 to O5, red) and an inactivation state (I, purple). B, Model of IKs contains 2 open states with no inactivation.
Figure 2
Figure 2
KCNQ1. A, Simulated current resulting from steps from −80 mV to various potentials (−70 to 40 mV) followed by a step to −70 mV (protocol shown in B). After stepping down to −70 mV, a hook is observed in the tail current indicating presence of inactivation, as observed experimentally. B, Simulated steady state current-voltage (I–V) curve (solid line) obtained from the protocol in A is compared with experiment (circles). C, Simulated current resulting from triple-pulse protocol (inset). Current resulting from the second depolarizing pulse shows no reactivation, indicating a delay before deactivation. The delay is due to accumulation in O4 and O5, as can be seen by the percentage (shown above tracing) of channels in these states late during the pulse. D, Simulated peak current for the second depolarizing pulse in C (solid line) normalized to the maximum current at 40 mV is compared with experiment (diamonds). Time constant of inactivation (from protocol in C) is also compared with experiment (squares). E, Simulated tail currents after various prepulse durations (protocol in inset). F, Relative inactivation and deactivation time constant with varying pre-pulse duration from the protocol in E. Simulated time constant of deactivation is normalized to 739 ms; experimental time constants (squares) are normalized to 365 ms. Relative inactivation is also compared with experiment (diamonds). B, D, and F were adapted from reference with permission from Blackwell Publishing.
Figure 3
Figure 3
Guinea pig and human IKs. A, Simulated guinea pig IKs current resulting from protocol in inset. A delay of several milliseconds is observed before depolarization at voltages <20 mV and is inversely proportional to voltage (inset enlarges the initial portion of the current tracings). Tail currents show no hook, indicating absence of inactivation, as in experiment. B, Simulated steady state guinea pig current-voltage (I–V) relationship from the protocol in A is compared with experiment (circles). Adapted from reference with permission from Lippincott Williams and Wilkins. C, Human IKs current resulting from the protocol in inset. Activation is slower than guinea pig IKs with a longer (20 ms) delay, and tail currents deactivate faster, as observe experimentally. D, Simulated steady state I–V relationship for human IKs compared with experiment (squares, protocol in C) and time constant of deactivation compared with experiment (circles, protocol in D inset). Adapted from references and , copyright 2001 and 2002, with permission from The European Society of Cardiology.
Figure 4
Figure 4
IKs role in APD adaptation. A, Fortieth AP at CL=250 ms (thin line) and CL=1000 ms (thick line) under control conditions. B, Guinea pig IKs during the APs in A. C, State occupancy during the 40th AP at slow rate (1000 ms). Green shows occupancy in zone 2 (Figure 1). Blue shows occupancy in zone 1. Red shows open channel occupancy (O1+O2). At AP initiation, most channels reside in zone 2. D, Occupancies at fast rate (CL=250 ms); same format as C. At the AP initiation, most channels reside in zone 1. Accumulation in zone 1 facilitates channel opening and larger IKs during the AP (B), causing APD shortening (A). Buildup of zone 1 reserve underlies the participation of IKs in APD rate adaptation. Open-state accumulation is minimal.
Figure 5
Figure 5
Dynamic guinea pig IKs conductance during AP clamp. Bottom, Experimentally measured IKs conductance (Chromanol 293B–sensitive current, g293B) at fast (CL=250 ms) and slow rates (CL=1000 ms) (thick and thin lines are mean and confidence limits, respectively). Arrows indicate open-state occupancy at AP outset. Reprinted from reference with permission from Blackwell Publishing. Top, Simulation also shows little open-state accumulation (arrow) even at fast rates; instead, in both simulation and experiment an increase in IKs activation rate during fast pacing is responsible for greater IKs during the AP.
Figure 6
Figure 6
Adaptation with human IKs vs human KCNQ1. A, Fortieth AP shown at CL=250 ms (thin line) and at 1000 ms (thick line). B, Same as A with KCNQ1. C, Human IKs during the AP at fast and slow rates. Some open-state accumulation at fast rate causes a small early jump (arrow), whereas closed-state accumulation in zone 1 creates a reserve that allows the current to increase to a late peak that shortens APD (E). D, HKCNQ1 during the AP at fast and slow rates. Slow kinetics of deactivation cause large open-state accumulation at fast rates and large instantaneous current on depolarization (arrow). Note that in the absence of zone 1 reserve (E), the current stays constant during the AP, lacking the late, repolarizing peak of IKs (C). E, Human IKs (black) and KCNQ1 (gray) zone 1 occupancy at CL=250 ms and 1000 ms. Fast-rate accumulation in zone 1 allows IKs to participate in adaptation. In contrast, little accumulation is seen in zone 1 for KCNQ1. ΔZone 1 is difference in occupancy between CL=250 ms and 1000 ms. F, APD adaptation curves for an AP with human IKs (solid line) and KCNQ1 (dashed line). Lack of KCNQ1 accumulation in zone 1 results in less APD shortening at fast rates compared with IKs.
Figure 7
Figure 7
IKs participation in RR. A, IKs accumulation compared with KCNQ1 at CL=500 ms. Mean current during the first AP (left) compared with the 40th AP (middle) shows significant increase for IKs, whereas KCNQ1 shows only a small increase (time dependence over the first 9 APs is shown in inset). When IKr is blocked (right), IKs increases further (doubling compared with first control AP), and KCNQ1 increase is small. B, In presence of IKr block, pause after 40 APs at CL=500 ms is simulated with IKs or KCNQ1. Postpause AP with IKs shows normal repolarization; AP with KCNQ1 develops a pause-induced EAD.

Comment in

References

    1. Sanguinetti MC, Curran ME, Zou A, Shen J, Spector PS, Atkinson DL, Keating MT. Coassembly of K(V)LQT1 and minK (IsK) proteins to form cardiac I(Ks) potassium channel. Nature. 1996;384:80–83. - PubMed
    1. Splawski I, Tristani-Firouzi M, Lehmann MH, Sanguinetti MC, Keating MT. Mutations in the hminK gene cause long QT syndrome and suppress IKs function. Nat Genet. 1997;17:338–340. - PubMed
    1. Antzelevitch C, Dumaine R. Electrical heterogeneity in the heart: physiological, pharmacological and clinical implications. In: Page E, Fozzard H, Solaro J, editors. Handbook of Physiology, Section 2: The Cardiovascular System, Volume I: The Heart. New York, NY: Oxford University Press; 2002. pp. 654–692.
    1. Marx SO, Kurokawa J, Reiken S, Motoike H, D’Armiento J, Marks AR, Kass RS. Requirement of a macromolecular signaling complex for beta adrenergic receptor modulation of the KCNQ1-KCNE1 potassium channel. Science. 2002;295:496–499. - PubMed
    1. Sicouri S, Quist M, Antzelevitch C. Evidence for the presence of M cells in the guinea pig ventricle. J Cardiovasc Electrophysiol. 1996;7:503–11. - PubMed

Publication types

LinkOut - more resources