. 2005 Sep 6;112(10):1451-61.
doi: 10.1161/CIRCULATIONAHA.105.537480. Epub 2005 Aug 29.

Dynamic imaging of allogeneic mesenchymal stem cells trafficking to myocardial infarction

Affiliations

Dynamic imaging of allogeneic mesenchymal stem cells trafficking to myocardial infarction

Dara L Kraitchman et al. Circulation. .

Abstract

Background: Recent results from animal studies suggest that stem cells may be able to home to sites of myocardial injury to assist in tissue regeneration. However, the histological interpretation of postmortem tissue, on which many of these studies are based, has recently been widely debated.

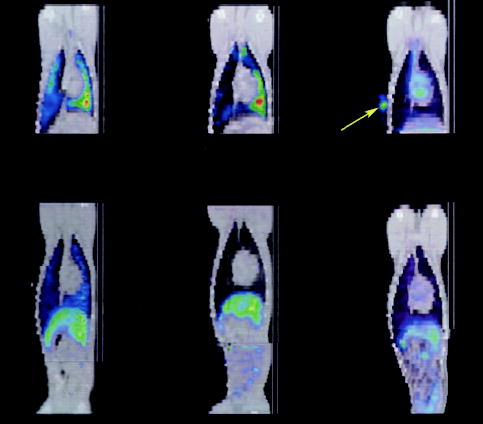
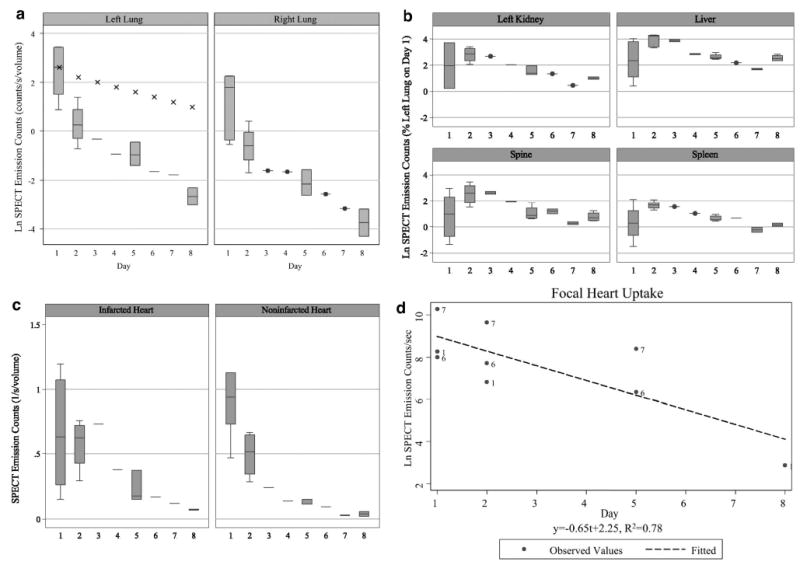
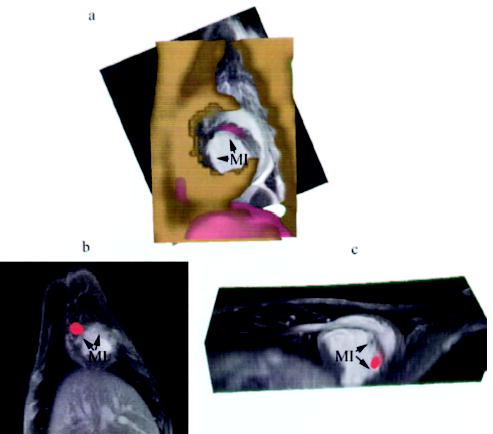
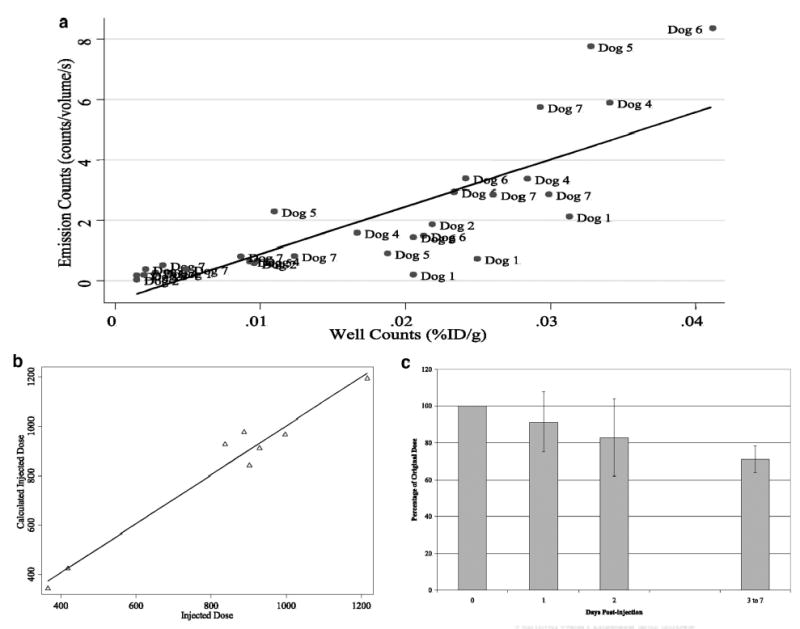
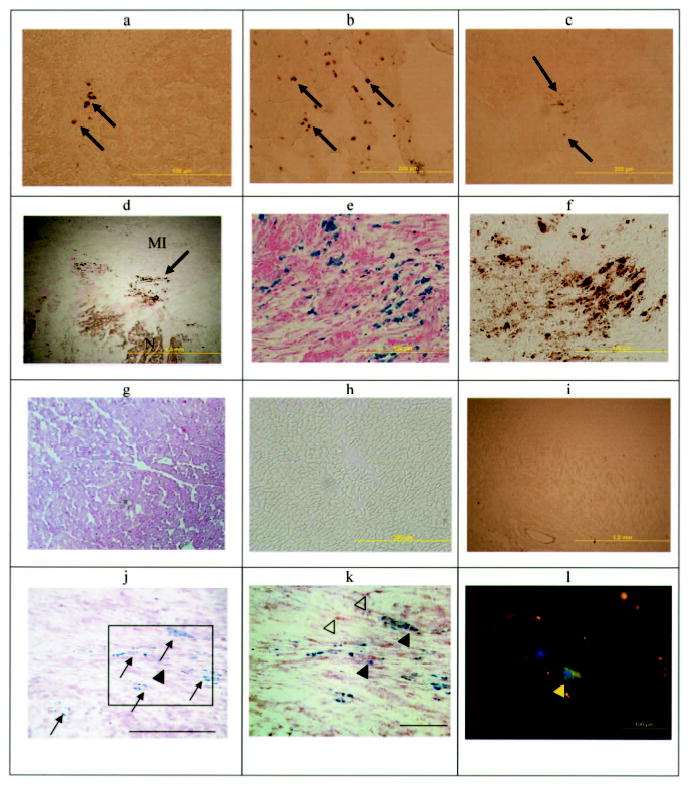
Methods and results: With the use of the high sensitivity of a combined single-photon emission CT (SPECT)/CT scanner, the in vivo trafficking of allogeneic mesenchymal stem cells (MSCs) colabeled with a radiotracer and MR contrast agent to acute myocardial infarction was dynamically determined. Redistribution of the labeled MSCs after intravenous injection from initial localization in the lungs to nontarget organs such as the liver, kidney, and spleen was observed within 24 to 48 hours after injection. Focal and diffuse uptake of MSCs in the infarcted myocardium was already visible in SPECT/CT images in the first 24 hours after injection and persisted until 7 days after injection and was validated by tissue counts of radioactivity. In contrast, MRI was unable to demonstrate targeted cardiac localization of MSCs in part because of the lower sensitivity of MRI.

Conclusions: Noninvasive radionuclide imaging is well suited to dynamically track the biodistribution and trafficking of mesenchymal stem cells to both target and nontarget organs.


Figures

Figure 1
Figure 1
a, Viable cell counts from in vitro assay of either unlabeled MSCs (control) or MSCs labeled with increasing doses of 111In oxine ranging from 5 to 30 μCi per million MSCs determined 1 to 7 days after labeling. Cells were initially plated in a T-25 flask at a density of 2 × 10⁶ MSCs. Cell counts were determined every other day in alternate flasks. Cell counts remained constant after adhering ≈48 hours after seeding. b, MTS assay measuring absorption of different doses of 111In oxine–labeled MSCs and unlabeled MSCs (control) at 1 to 8 days after labeling. At 6 days after labeling, unlabeled MSCs showed an increased metabolic activity relative to labeled cells (*P < 0.001). However, no dose-dependent change in metabolic activity was noted between different amounts of MSC radiolabeling.
Figure 2
Figure 2
Adipogenic differentiation of MSCs in vitro was confirmed with Oil Red O staining, in which lipid vacuoles stain red. Both unlabeled (a) and 111In oxine–labeled MSCs (b = 5; c = 10; d = 20; and e = 30 μCi/million MSCs) showed equivalent ability to differentiate.
Figure 3
Figure 3
Coronal fused SPECT (color) and CT (gray-scale) image of a dog with (top left) and without (top middle) MI during the first hours after intravenous injection of 111In oxine–labeled MSCs showing predominant lung uptake with increased uptake to the dependent left lung (green-yellow color toward right). In a dog with MI that received 111In oxine without MSCs (top right), the tracer behaves primarily as a blood pool agent, with uptake visible in left and right ventricles of the heart. A reference marker (arrow) containing 111In oxine was placed on the chest wall on the dog that did not receive MSCs (top right). Redistribution of 111In oxine–labeled MSCs to predominantly the liver occurs at 24 hours after intravenous injection in both a representative infarcted (bottom left) and noninfarcted (bottom middle) dog. In an infarcted dog injected intravenously with 111In oxine only (ie, no MSCs), a similar pattern of redistribution to the liver is observed at 24 hours after injection (bottom right).
Figure 4
Figure 4
a, Box-whisker plot of natural log of lung emission counts by imaging day. Initially, more radiolabeled MSCs are present in the left lung (left) than the right lung (right) because of the injection being performed with the animal on the left side (ie, dependent lung uptake). The lung emission counts over time decay faster than predicted by radioactive decay alone (eg, linear decay shown as crosses), indicating either redistribution of MSCs to other organs or cell death and removal. b, Uptake of 111In oxine–labeled MSCs increased in the kidney, liver, spine, and spleen at 24 hours after injection (day 2). After day 3, the uptake decreased at a rate faster than the radioactive decay of 111In oxine, indicating cell loss or loss of tracer. c, Activity in the infarcted anterior apex of the heart (left) was relatively constant for the first 24 hours after injection, indicating redistribution of 111In oxine–labeled MSCs to the infarcted tissue, whereas a rapid decrease in activity in the noninfarcted myocardium (right) was observed in the first 24 hours after injection, indicating a combination of radioactive decay plus loss of MSCs in normal heart tissue. d, In 3 animals demonstrating a focal uptake of activity to the heart, the decay of the activity was ≈3 times faster than predicted for radioactive decay of 111In oxine.
Figure 5
Figure 5
Sagittal (left) and coronal (right) view of fused SPECT/CT images on days 1 (a), 2 (b), and 7 (c) in an animal that demonstrated focal uptake in the anterior midventricular region of the heart. d to f, At the last imaging time point (days 5 to 8), an anterior apical region of MSC uptake (arrow) is shown in 3 representative animals in the coronal view. This more anterior apical distribution was present independent of whether an early focal hot spot was observed (yellow arrowhead, f only).
Figure 6
Figure 6
Registration of SPECT/CT with MR images of the heart demonstrating focal uptake of MSCs in the peri-infarcted region. a, Short-axis view of alignment of CT (gold) with MRI (gray scale) and SPECT (red) showing focal uptake in the septal region of the MI in a representative dog. b, Focal uptake on SPECT (red) in another animal demonstrating localization of the MSCs to the infarcted myocardium (MI) in the short-axis (b) and long-axis (c) views.
Figure 7
Figure 7
a, Correlation between SPECT emission counts and gamma well counts from spleen, liver, lung, kidney, and heart. Predicted robust regression (solid line) demonstrates high agreement between quantitative SPECT imaging and tissue gamma well counting (y = 156.1x − 0.67; R2 = 0.66). b, Actual injected dose to the calculated injected dose (linear regression: y = 0.99x + 11.9; R2 = 0.96) showing ≈12 μCi error in measurement with the use of our specialized reconstruction technique. c, Percentage of the original injected radio-tracer dose that can be accounted for in the whole body after decay correction. After 1 to 2 half-lives, ≈71% of the original dose is retained within the body.
Figure 8
Figure 8
Photomicrographs of various organs demonstrating the presence or absence of Feridex-labeled MSCs. DAB-enhanced Prussian blue–stained photomicrographs of liver (a), lung (b), spleen (c), and heart (d) demonstrate iron-positive cells in these organs. Higher magnification of d showing Prussian blue staining with (e) and without (f) DAB enhancement demonstrates the intracytoplasmic iron and MSC localization in the MI rim (N indicates normal myocardium). No iron-positive cells were demonstrated with or without DAB-enhanced Prussian blue staining in the noninfarcted myocardium (g, h) or kidney (i). j, Double-staining cells for acid phosphatase (red) and iron (blue) indicate that macrophages (arrowhead) in the heart were rare, whereas the majority of Prussian blue–positive cells were the original Feridex-PLL–labeled MSCs (arrows) (bar = 200 μm). k, Inset of j at a higher magnification demonstrates primarily MSCs (blue stain) with a few macrophages with (filled arrowheads) and without (open arrowheads) iron (bar = 100 μm). l, Dextran staining (green, yellow arrow) indicates Feridex retention in a labeled MSC in the heart. Nuclei are stained with DAPI (blue).

Similar articles

Cited by

References

    1. Kocher AA, Schuster MD, Szabolcs MJ, Takuma S, Burkhoff D, Wang J, Homma S, Edwards NM, Itescu S. Neovascularization of ischemic myocardium by human bone-marrow-derived angioblasts prevents cardiomyocyte apoptosis, reduces remodeling and improves cardiac function. Nat Med. 2001;7:430–436. - PubMed
    1. Bittner RE, Schofer C, Weipoltshammer K, Ivanova S, Streubel B, Hauser E, Freilinger M, Hoger H, Elbe-Burger A, Wachtler F. Recruitment of bone-marrow-derived cells by skeletal and cardiac muscle in adult dystrophic mdx mice. Anat Embryol (Berl) 1999;199:391–396. - PubMed
    1. Britten MB, Abolmaali ND, Assmus B, Lehmann R, Honold J, Schmitt J, Vogl TJ, Martin H, Schachinger V, Dimmeler S, Zeiher AM, Teupe C, Britten M, Dobert N, Grunwald F, Aicher A, Urbich C, Hoelzer D. Infarct remodeling after intracoronary progenitor cell treatment in patients with acute myocardial infarction (TOPCARE-AMI): mechanistic insights from serial contrast-enhanced magnetic resonance imaging. Circulation. 2003;108:2212–2218. - PubMed
    1. Bittira B, Shum-Tim D, Al-Khaldi A, Chiu RC. Mobilization and homing of bone marrow stromal cells in myocardial infarction. Eur J Cardiothorac Surg. 2003;24:393–398. - PubMed
    1. Orlic D, Kajstura J, Chimenti S, Limana F, Jakoniuk I, Quaini F, Nadal-Ginard B, Bodine DM, Leri A, Anversa P. Mobilized bone marrow cells repair the infarcted heart, improving function and survival. Proc Natl Acad Sci U S A. 2001;98:10344–10349. - PMC - PubMed

Publication types

MeSH terms