Comparative Study
. 2005 Aug 31;25(35):7914-23.
doi: 10.1523/JNEUROSCI.1471-05.2005.

Gating reaction mechanisms for NMDA receptor channels

Affiliations
Comparative Study

Gating reaction mechanisms for NMDA receptor channels

Anthony Auerbach et al. J Neurosci. .

Abstract

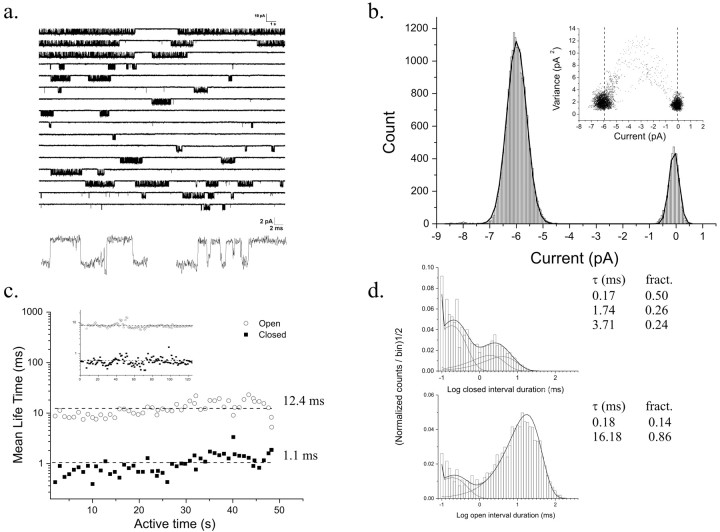
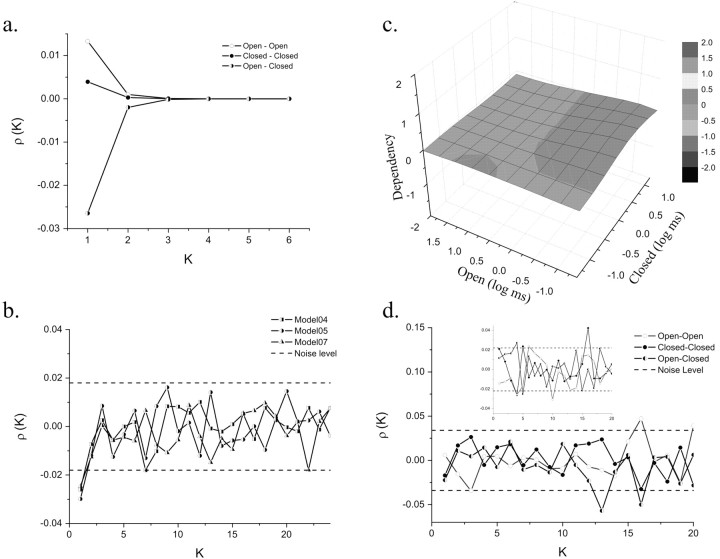
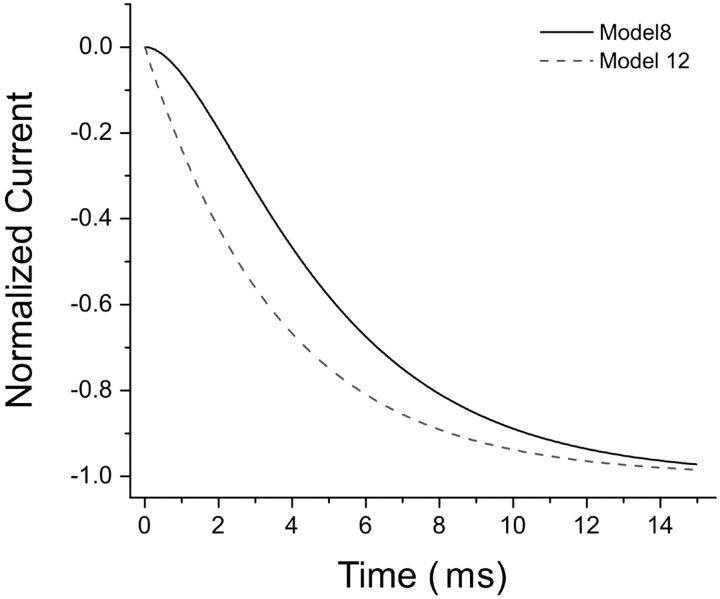
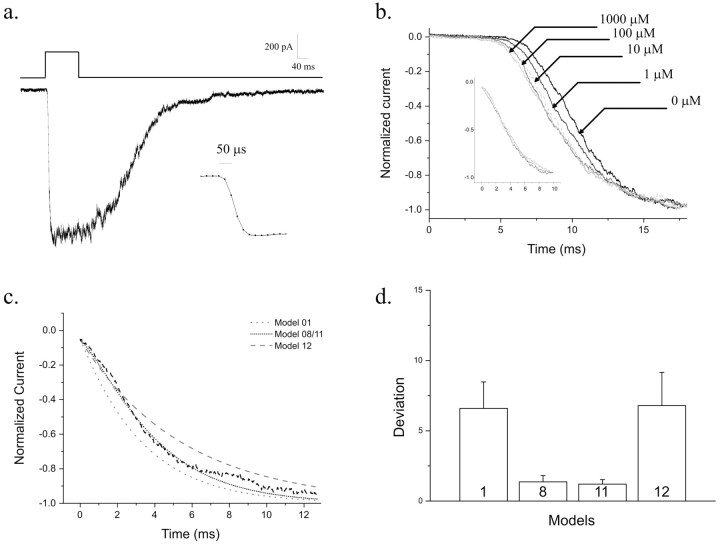
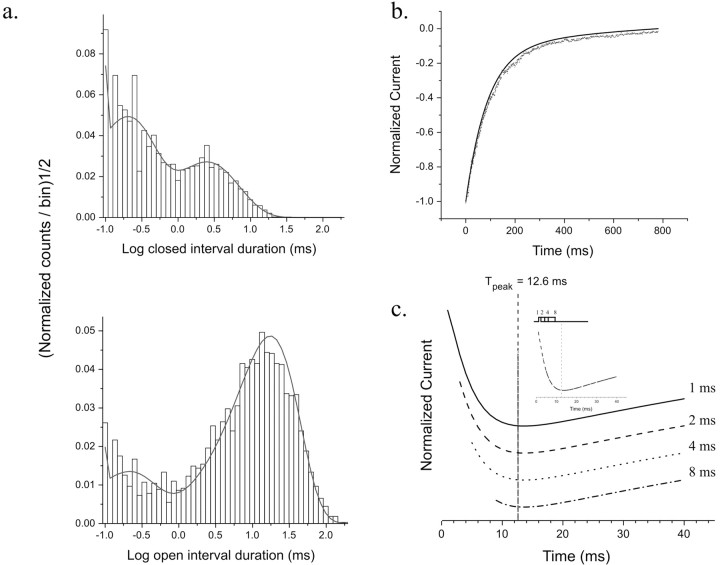
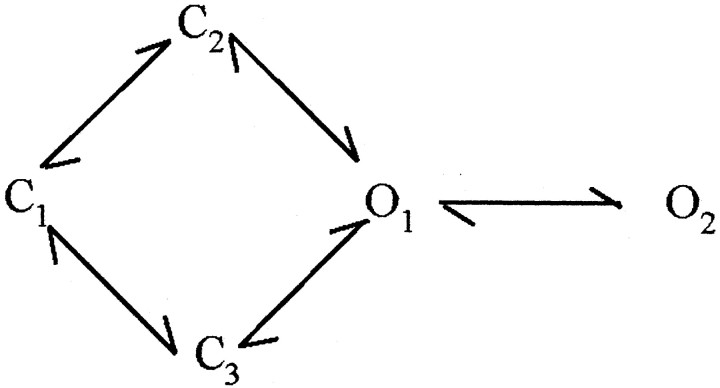
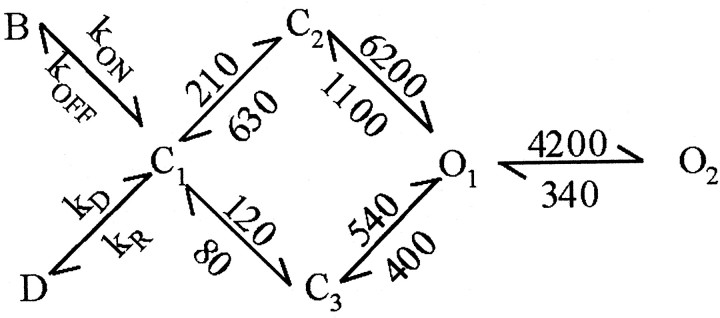
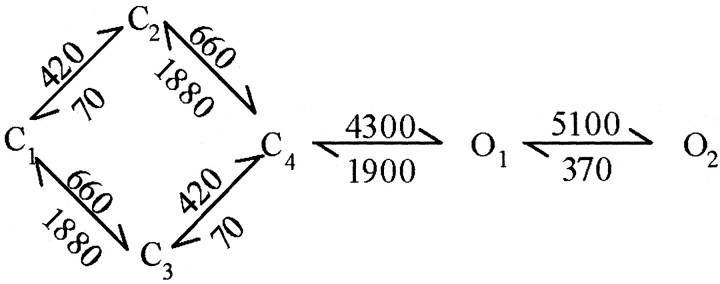
NMDA receptors (NMDARs) mediate the slow component of excitatory transmission in the CNS and play key roles in synaptic plasticity and excitotoxicity. We investigated the gating reaction mechanism of fully liganded NR1/NR2A recombinant NMDARs (expressed in Xenopus oocytes) by fitting all possible three-closed/two-open-state, noncyclic kinetic schemes to currents elicited by saturating concentrations of glutamate plus glycine. The adequacy of each scheme was assessed by maximum likelihood values and autocorrelation coefficients of single-channel currents, as well as by the predicted time courses of transient macroscopic currents. Two schemes provided the best description for NMDAR gating at both the single-channel and macroscopic levels. These two schemes had coupled open states, only one gateway between the closed and open aggregates, and at least two preopening closed states. These two models could be condensed into a cyclic reaction mechanism. Using a linear reaction scheme, the overall "gating" rates (from the initial stable closed state to the final stable open state) are 177 and 4.4 s(-1).


Figures

Figure 1.
Figure 1.
Single-channel activity of NMDARs elicited by 1 mm glutamate and 100 μm glycine in the presence of 1 mm EDTA. a, Continuous record from an outside-out patch at –80 mV. Occasional alternative conductance levels are displayed on an expanded time scale below. b, Amplitude histogram constructed from activation bursts and the corresponding mean–variance analysis (inset, 10-sample sliding window). There is primarily one conducting amplitude level with a mean of 5.99 pA. c, The mean closed and open durations for each second of active time are stable. An interval duration stability analysis from a cell-attached patch is shown (inset). d, Duration distributions of intracluster closed (top) and open (bottom) intervals. Mean lifetimes and relative areas of each exponential component are shown (right). fract., Fraction.
Figure 2.
Figure 2.
Correlation analyses of NMDAR-idealized single-channel currents, from experimental and simulated currents. a, Autocorrelation coefficients of open, closed, and open–closed interval pairs predicted by model 4. b, Autocorrelation coefficients of open–closed interval pairs simulated by using models4, 5, and 7 (total number of events, n = 11,000). The dashed horizontal lines are formula image, which is plus or minus twice the SE of the estimate in the case of white noise. c, 2D dependency plot of 7629 intraburst intervals from one outside-out patch. There is no significant dependency between adjacent open and closed intervals. d, Autocorrelation coefficients for the open, closed, and open–closed interval pairs from experimental NMDAR current cluster recorded from an outside-out patch (n = 3274). Autocorrelation coefficients for the open–open, closed–closed, and open–closed interval pairs from one activation cluster recorded from a cell-attached patch are shown (n = 9760) (inset). K, Step size; ρ(K), autocorrelation coefficient.
Figure 3.
Figure 3.
Time course of the macroscopic current predicted by models having different numbers of preopening closed states. The solid line was simulated from model 8 with the assumption that activation starts from C1. The dashed line was simulated from model 12 with C3 as the starting point. The rate constants used for simulation were obtained by globally fitting activation bursts from four patches.
Figure 4.
Figure 4.
The rising phase of NMDAR macroscopic current evoked by fast application of saturating concentrations of agonists is satisfied by models 8 and 11. a, Macroscopic current induced by 1 mm glutamate plus 100 μm glycine applied to an outside-out macropatch (–60 mV). The top trace is the command pulse indicating agonist application. The inset is the open-tip response recorded on the same patch pipette, on expanded scale. b, Macroscopic currents after a concentration jump from solutions containing different concentrations of glycine with no glutamate to a solution containing 100 μm glycine and 1 mm glutamate. Alignment of the 5–95 % rising phases of the currents is shown (inset). c, Comparison of experimental and simulated macroscopic currents. Only the best result from each model was used for comparison. The simulated currents from models 8 and 11 overlap. d, Deviations calculated by Equation 7 of predicted currents from experimental current. Models 8 and 11 provide equivalent and superior descriptions of the experimental current. Error bars indicate SE.
Figure 5.
Figure 5.
Both microscopic and macroscopic currents are described by model 16. a, Histograms of intraburst interval distributions. The solid lines are calculated from the model. b, Simulated (solid line) and experimental current decays after a 100 ms pulse of 1 mm glutamate plus 100 μm glycine. Binding and desensitization states (both connected to C1) were added to model 16. The dashed line is the fit of experimental current by the sum of two exponentials. c, Simulations of the current response to short pulses (1, 2, 4, and 8 ms) of saturating agonists (model 16). The time to peak (Tpeak) is the same for all pulse durations. Currents are staggered vertically for display purposes. The inset is the superimposed view of these traces.
None
Model 16
None
Model 16a
None
Model 17
None
Model 11a

References

    1. Auerbach A (2005) Gating of acetylcholine receptor channels: brownian motion across a broad transition state. Proc Natl Acad Sci USA 102: 1408–1412. - PMC - PubMed
    1. Banke TG, Traynelis SF (2003) Activation of NR1/NR2B NMDA receptors. Nat Neurosci 6: 144–152. - PubMed
    1. Banke TG, Dravid SM, Traynelis SF (2005) Protons trap NR1/NR2B NMDA receptors in a nonconducting state. J Neurosci 25: 42–51. - PMC - PubMed
    1. Behe P, Stern P, Wyllie DJ, Nassar M, Schoepfer R, Colquhoun D (1995) Determination of NMDA NR1 subunit copy number in recombinant NMDA receptors. Proc R Soc Lond B Biol Sci 262: 205–213. - PubMed
    1. Benveniste M, Mayer ML (1991a) Kinetic analysis of antagonist action at N-methyl-d-aspartic acid receptors. Two binding sites each for glutamate and glycine. Biophys J 59: 560–573. - PMC - PubMed

Publication types

Substances

LinkOut - more resources