. 2006 Jan 1;393(Pt 1):151-9.
doi: 10.1042/BJ20051280.

Stronger control of ATP/ADP by proton leak in pancreatic beta-cells than skeletal muscle mitochondria

Affiliations

Stronger control of ATP/ADP by proton leak in pancreatic beta-cells than skeletal muscle mitochondria

Charles Affourtit et al. Biochem J. .

Abstract

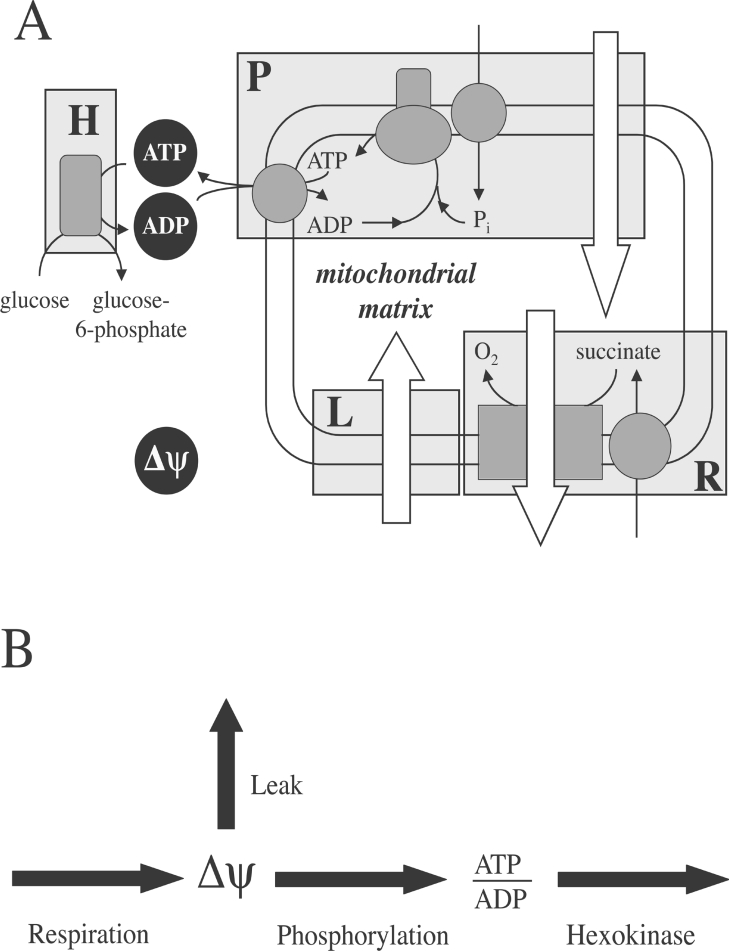
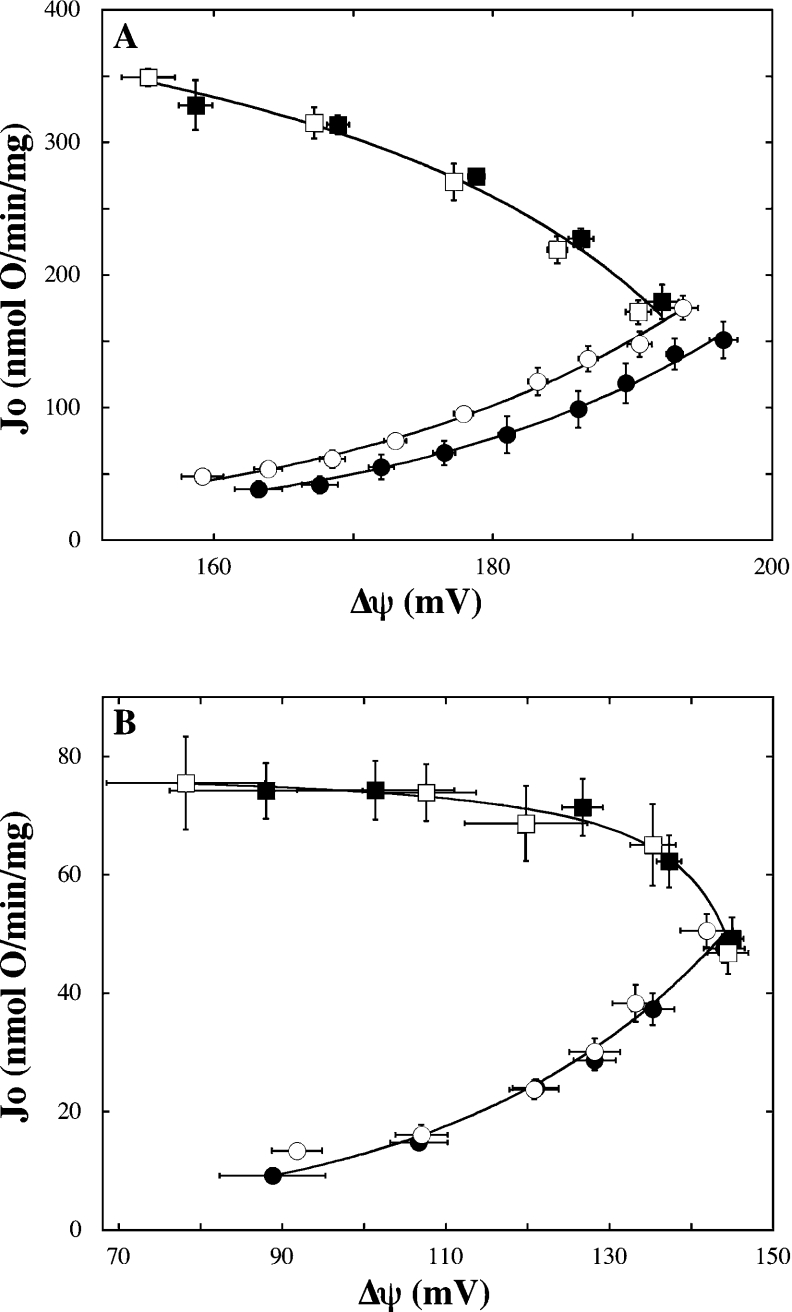
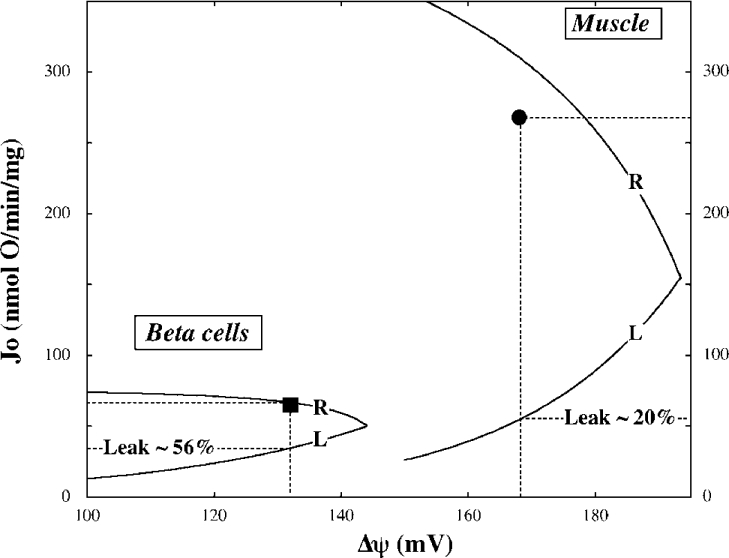
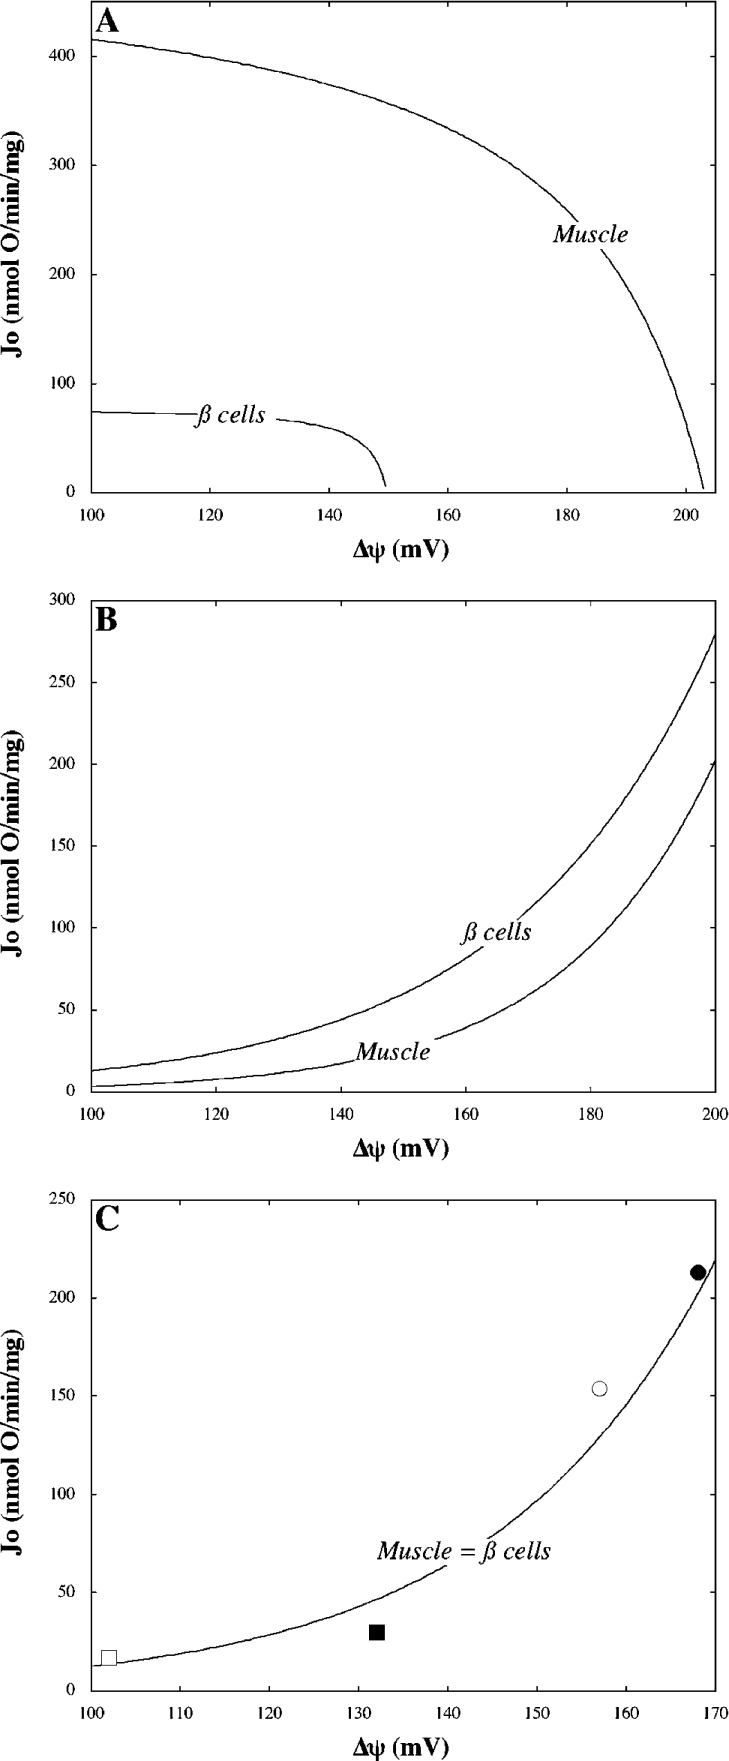
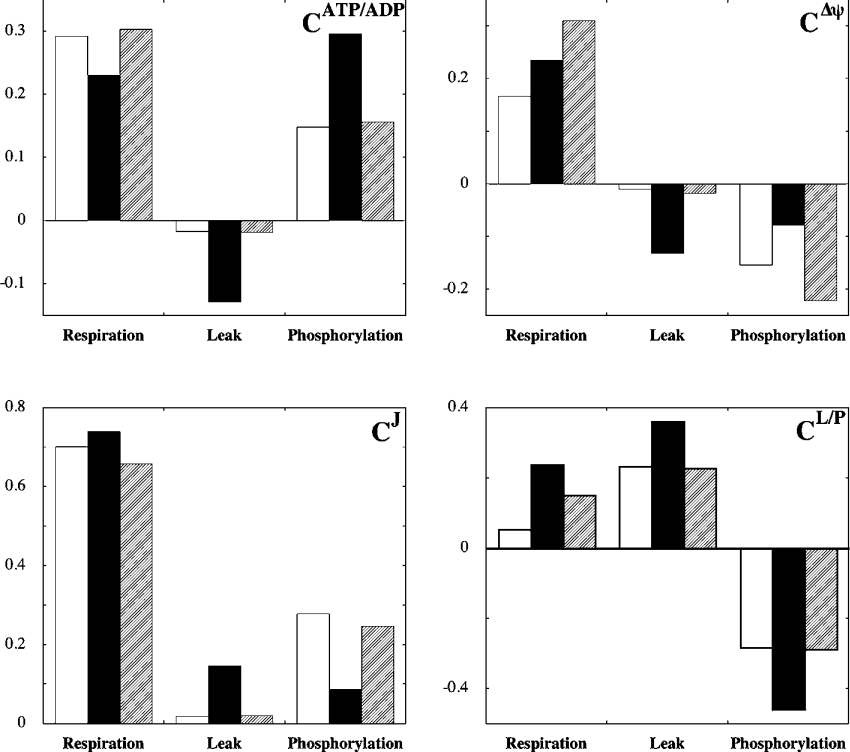
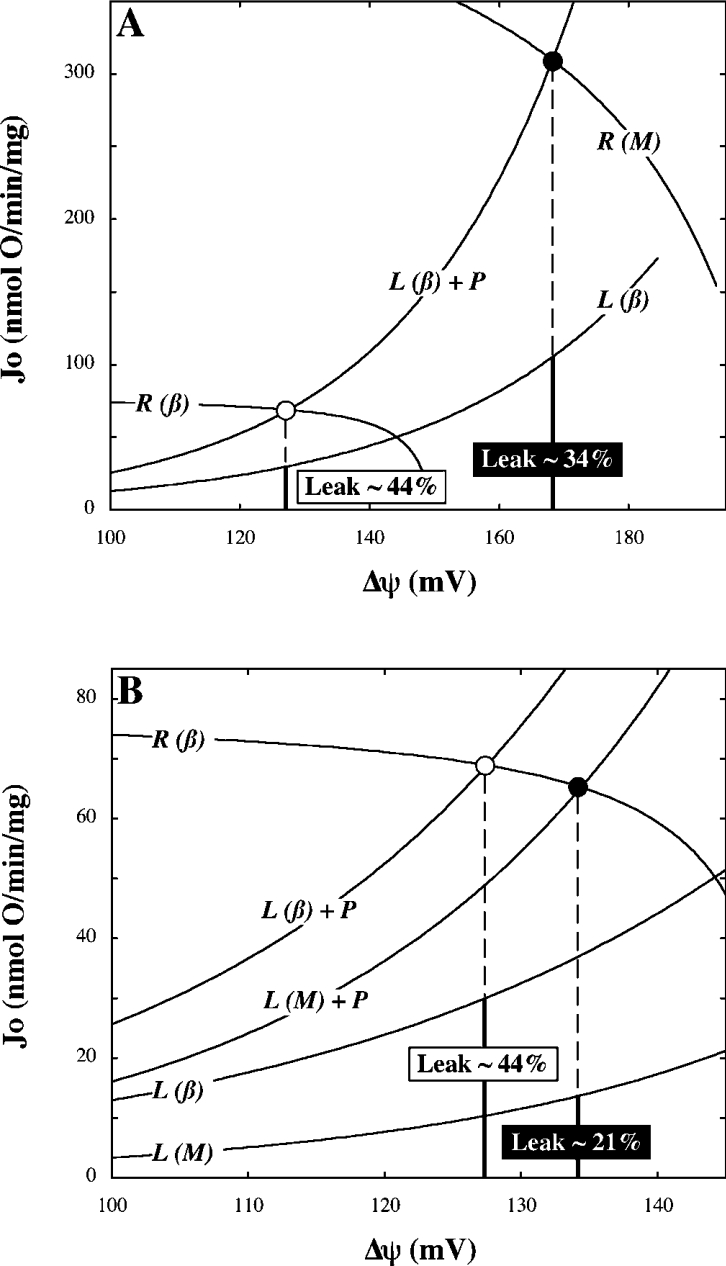
Pancreatic beta cells respond to rising blood glucose concentrations by increasing their oxidative metabolism, which leads to an increased ATP/ADP ratio, closure of K(ATP) channels, depolarization of the plasma membrane potential, influx of calcium and the eventual secretion of insulin. Such a signalling mechanism implies that the ATP/ADP ratio is flexible in beta cells (beta-cells), which is in contrast with other cell types (e.g. muscle and liver) that maintain a stable ATP/ADP poise while respiring at widely varying rates. To determine whether this difference in flexibility is accounted for by mitochondrial peculiarities, we performed a top-down metabolic control analysis to quantitatively assess how ATP/ADP is controlled in mitochondria isolated from rat skeletal muscle and cultured beta cells. We show that the ATP/ADP ratio is more strongly controlled (approx. 7.5-fold) by proton leak in beta cells than in muscle. The comparatively high importance of proton leak in beta cell mitochondria (relative to phosphorylation) is evidenced furthermore by its relatively high level of control over membrane potential and overall respiratory activity. Modular-kinetic analysis of oxidative phosphorylation reveals that these control differences can be fully explained by a higher relative leak activity in beta cell mitochondria, which results in a comparatively high contribution of proton leak to the overall respiratory activity in this system.


Figures

Figure 1
Figure 1. Mitochondrial oxidative phosphorylation from a top-down perspective
As explained fully in the Materials and methods section, 4 enzymatic units – respiration (R), leak (L), phosphorylation (P) and hexokinase (H) – communicate through two metabolic intermediates, Δψ and extra-mitochondrial ATP/ADP. Open arrows in (A) represent proton translocation across the mitochondrial inner-membrane.
Figure 2
Figure 2. Sensitivity of respiration and leak to ATP/ADP
The kinetic dependency of respiration (squares) and leak (circles) on Δψ was determined in mitochondria from muscle (A) and beta cells (B) in the exclusive presence of 0.15 mM ATP (filled symbols) or 0.15 mM ADP (open symbols). Respiration and leak data were fitted mathematically to hyperbolic [Jo=(αΔψ+β)/(γΔψ+1)] and exponential (Jo=αeβΔψ) equations respectively where Jo is the rate of oxygen uptake/mg of protein, α, β and γ are fit parameters. Correlation coefficients of all models were equal to or exceeded 0.99. Data points and error bars represent mean±S.E.M. of 6 (leak, both systems), 3 (respiration, muscle), 7 (respiration-ADP, beta cells) or 10 (respiration-ATP, beta cells) independent mitochondrial samples.
Figure 3
Figure 3. Contribution of proton leak to overall respiratory activity
Curves representing the kinetic dependencies of leak (L) and respiration (R) on Δψ are the same as those describing the experimental data shown in Figure 2, except for the muscle leak curve which describes the combined data obtained in the presence of either ATP or ADP. Steady state parameters, determined during state 3 oxidation of succinate in mitochondria from muscle (●) and beta cells (■), were taken from Table 1. Leak contribution (%) was calculated from 15–16 independent experiments. Note that partitioning of flux for control analysis was calculated from the averaged experimental data shown in Table 1.
Figure 4
Figure 4. Modular kinetics
Models representing respiration (A) and leak (B) kinetics with respect to Δψ were taken from Figure 3 and extrapolated to allow direct comparison between beta cells and muscle. Steady state phosphorylation activities (C) in muscle (circles) and beta cell (squares) mitochondria were calculated by subtracting leak activities (B) from overall state 3 respiratory activities shown in Table 1; filled symbols represent uninhibited steady states whereas open symbols reflect the states achieved upon specific partial inhibition of respiration. Combined data were fitted to a single exponential equation (correlation coefficient=0.97).
Figure 5
Figure 5. The effect of flux partitioning on distribution of control
Control coefficients quantifying control of ATP/ADP (CATP/ADP), Δψ (CΔψ), overall respiratory flux (CJ) and of the ratio of leak and phosphorylation fluxes (CL/P). Values were calculated from averaged experimental data and represent control strengths in muscle (open bars) and beta cell (filled bars) mitochondria (compare Figure 5 with Table 3). Hatched bars represent beta cell control coefficients that were recalculated with the ratio of leak and phosphorylation activities changed to the level observed in muscle.
Figure 6
Figure 6. Modelled kinetic interaction between Δψ-establishing and Δψ-dissipating modules
Curves describe the kinetic behaviour of respiration (R) and leak (L) with respect to Δψ as measured in muscle (M) and beta cell (β) mitochondria (compare with Figures 4A and 4B). Total Δψ-dissipating activity (L+P) was modelled by summation of the phosphorylation (Figure 4C) and respective leak curves. The intersect of the curves labelled R(β) and L(β)+P models the steady state achieved in beta cells oxidizing succinate in state 3 (compare with Table 1, ○). (A) and (B) respectively, predict how this state shifts when respiration or leak kinetics are altered to the relationships observed in muscle (●). Percentages indicate the contribution of leak to overall respiration in the respective modelled states.

References

    1. Kiberstis P. A. A surfeit of suspects. Science (Washington DC) 2005;307:369.
    1. Lowell B. B., Shulman G. I. Mitochondrial dysfunction and type 2 diabetes. Science (Washington DC) 2005;307:384–387. - PubMed
    1. Rutter G. A. Nutrient-secretion coupling in the pancreatic islet β-cell: recent advances. Mol. Asp. Med. 2001;22:247–284. - PubMed
    1. Ainscow E. K., Brand M. D. Top-down control analysis of ATP turnover, glycolysis and oxidative phosphorylation in rat hepatocytes. Eur. J. Biochem. 1999;263:671–685. - PubMed
    1. Matschinsky F. M., Glaser B., Magnuson M. A. Pancreatic β-cell glucokinase: closing the gap between theoretical concepts and experimental realities. Diabetes. 1998;47:307–315. - PubMed

Publication types