. 2005 Sep 21;24(18):3190-201.
doi: 10.1038/sj.emboj.7600800. Epub 2005 Sep 1.

Structural basis for the interaction of Bordetella pertussis adenylyl cyclase toxin with calmodulin

Affiliations

Structural basis for the interaction of Bordetella pertussis adenylyl cyclase toxin with calmodulin

Qing Guo et al. EMBO J. .

Abstract

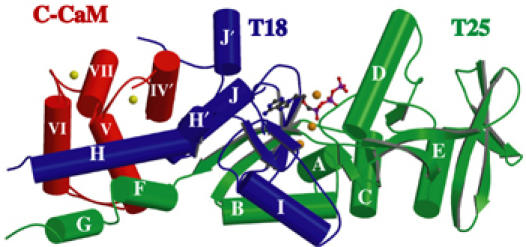
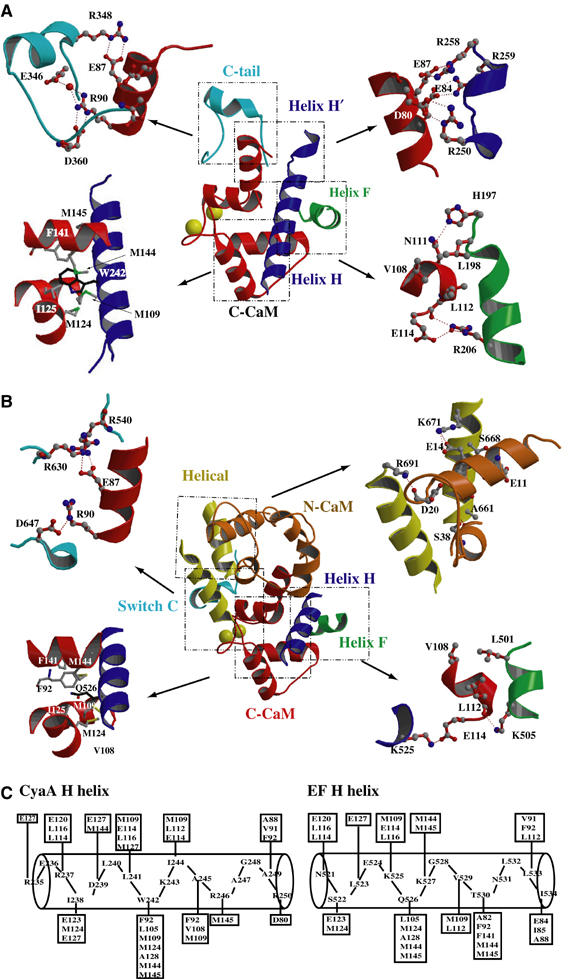
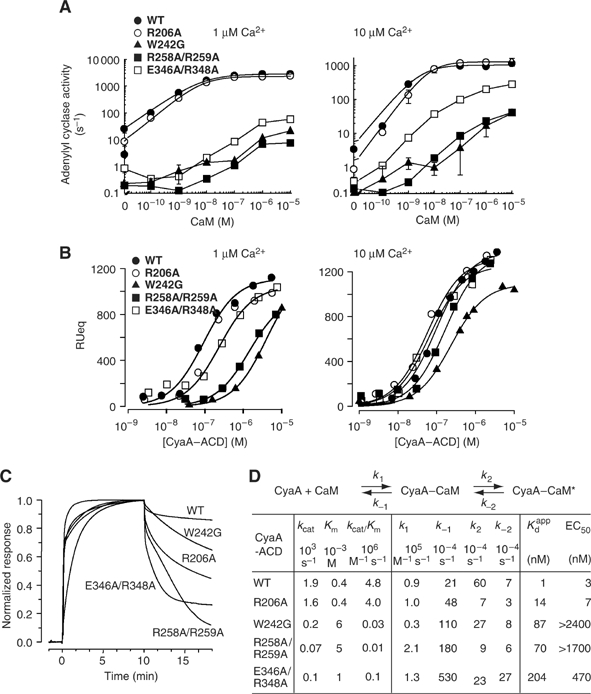
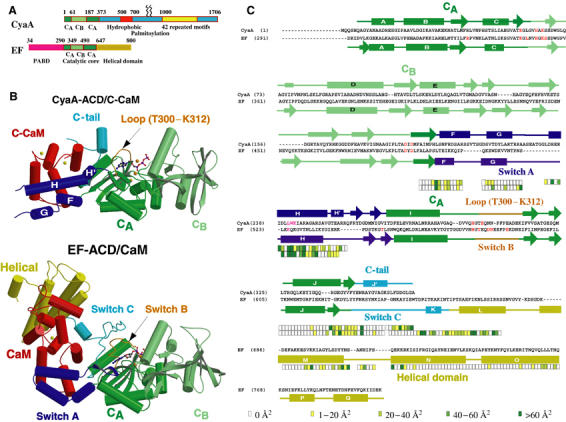
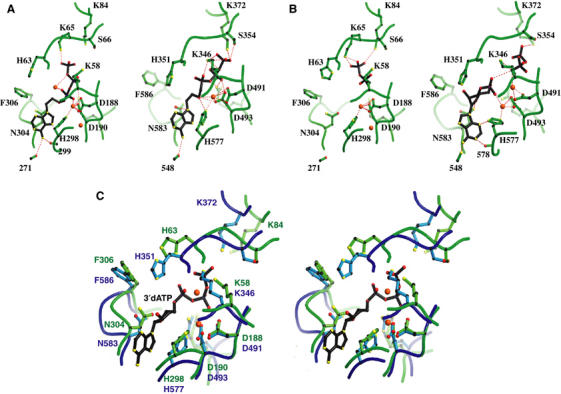
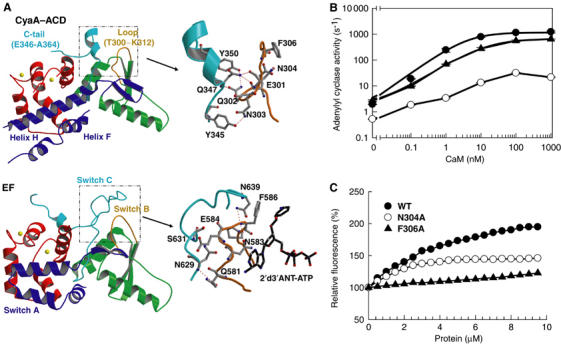
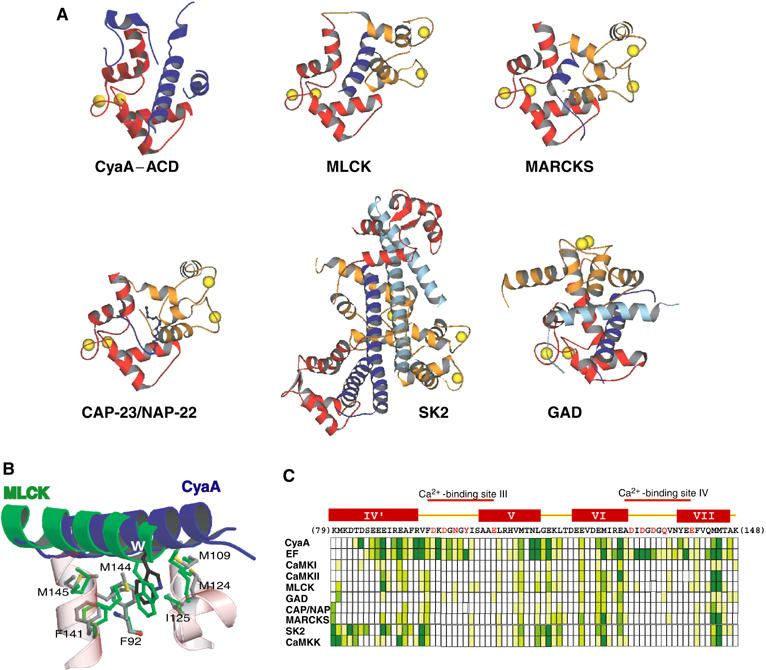
CyaA is crucial for colonization by Bordetella pertussis, the etiologic agent of whooping cough. Here we report crystal structures of the adenylyl cyclase domain (ACD) of CyaA with the C-terminal domain of calmodulin. Four discrete regions of CyaA bind calcium-loaded calmodulin with a large buried contact surface. Of those, a tryptophan residue (W242) at an alpha-helix of CyaA makes extensive contacts with the calcium-induced, hydrophobic pocket of calmodulin. Mutagenic analyses show that all four regions of CyaA contribute to calmodulin binding and the calmodulin-induced conformational change of CyaA is crucial for catalytic activation. A crystal structure of CyaA-calmodulin with adefovir diphosphate, the metabolite of an approved antiviral drug, reveals the location of catalytic site of CyaA and how adefovir diphosphate tightly binds CyaA. The ACD of CyaA shares a similar structure and mechanism of activation with anthrax edema factor (EF). However, the interactions of CyaA with calmodulin completely diverge from those of EF. This provides molecular details of how two structurally homologous bacterial toxins evolved divergently to bind calmodulin, an evolutionarily conserved calcium sensor.


Figures

Figure 1
Figure 1
Secondary structure of CaM-bound CyaA–ACD in the presence of adefovir diphosphate. T25 and T18 domains of CyaA–ACD are colored green and purple, respectively. C-CaM is colored red. Calcium ions are colored yellow and magnesium ions orange. The carbon, oxygen, nitrogen, and phosphorus atoms of adevofir diphosphate are colored gray, red, blue, and purple, respectively.
Figure 2
Figure 2
Interactions of CaM with CyaA–ACD. (A) Detailed interactions of C-CaM with four discrete regions of CyaA–ACD. C-CaM is colored red and N-CaM is colored in orange. The C-CaM-contact regions, helix F, helices H/H′, and the C-terminal tail of CyaA–ACD are colored green, purple, and cyan, respectively. The atoms carbon, oxygen, nitrogen, and sulfur are colored in gray, red, blue, and green, respectively. (B) The interactions of CaM with EF for the comparison. The corresponding CaM contact regions of EF, helix F, and helix H at switch A are colored green and purple, respectively. The two additional CaM contact regions, switch C and the helical domain, are colored cyan and yellow, respectively. (C) Schematic diagram showing the major contact between C-CaM with the helix H of CyaA–ACD and EF. The CaM residues within 4 Å distance of the indicated residues of CyaA–ACD are boxed.
Figure 3
Figure 3
Characterization of CyaA–ACD mutants. (A) The activation of CyaA–ACD and its mutants by CaM at 1 and 10 μM free Ca2+ concentration. Assays were performed in the presence of 10 mM MgCl2 and 5 mM ATP. (B) Equilibrium binding isotherms of CyaA and its mutant to cutinase-CaM at 1 μM (left) and 10 μM (right) free Ca2+. (C) Representative normalized SPR sensorgrams of the binding of cutinase-CaM with CyaA–ACD and its mutants at 10 μM free Ca2+ concentration. (D) Kinetic parameters of CyaA mutants. The kcat and Km values were derived from enzymatic assays with variable ATP concentrations. Apparent dissociation constant (Kdapp) calculated from these kinetic parameters based on the conformational change model listed above and χ2 values were below 20 in all analyses. K1=k−1/k1 and K2=k2/k−2. Kdapp=K1/(1+K2). EC50 values for CaM activation were derived from curve fitting of the CaM activation curve at 10 μM Ca2+ to a simple rectangular hyperbola.
Figure 4
Figure 4
Comparison of C-CaM-bound CyaA–ACD and CaM-bound EF–ACD. (A) Diagram for the domain organization of CyaA and EF. CyaA has the N-terminal ACD containing CA and CB domains, and the C-terminal domain for membrane insertion, receptor binding, and hemolytic activity. EF has the N-terminal anthrax protective antigen-binding domain (PABD) and C-terminal ACD that contains the catalytic core (CA and CB) and helical domains. (B) Secondary structure of CaM-bound CyaA–ACD (top) and CaM-bound EF–ACD (bottom). CA and CB domains of CyaA–ACD and EF–ACD are colored green and light green, respectively. C-CaM (CyaA–ACD) and CaM (EF–ACD) are colored red. The helical domain of EF is colored yellow. The three switch regions, switch A, switch B, and switch C of EF, are colored purple, orange, and cyan, respectively. The regions, helices F–H′, loop T300–K312, and the C-tail of CyaA–ACD, that correspond to the three switch regions of EF are colored purple, orange, and cyan, respectively. Calcium ions are colored yellow and magnesium ions orange. The carbon, oxygen, nitrogen, and phosphorus atoms of adefovir diphosphate (CyaA–ACD) and 3′dATP (EF–ACD) are colored gray, red, blue, and purple, respectively. (C) Sequence alignment of CyaA–ACD and EF–ACD. The secondary structure assignment of CyaA–ACD is shown above the sequences of CyaA and that of EF is below the sequences of EF. The color boxes below indicate the contact areas (Å2) of CyaA and EF buried by CaM in four shades of green. Residues in CyaA–ACD and EF–ACD that are shown to be involved in catalysis and CaM binding by mutagenic analyses are colored red and magenta, respectively (Glaser et al, 1989, 1991; Munier et al, 1992; Drum et al, 2000, 2002).
Figure 5
Figure 5
Comparison of nucleotide binding of CyaA and EF. (A) Active site of CyaA–ACD with adefovir diphosphate (left, accession number 1ZOT) and EF–ACD (right, 1PK0) in the presence of adefovir diphosphate. The atoms, carbon, oxygen, and nitrogen, are black, red, and yellow, respectively. Three Mg2+ ions and one Yb3+ ion are colored red at the active sites of CyaA–ACD and EF–ACD, respectively. (B) Active site of CyaA–ACD with PPi (left, 1COL) and EF–ACD with cAMP and PPi (right, 1SK6). Two Mg2+ ions and two Yb3+ ions are colored red at the active sites of CyaA–ACD and EF–ACD, respectively. (C) Comparison of the catalytic site of CyaA–ACD (1YRT) with EF–Mg2+–3′dATP (1XFV) in the stereo view. The main chains of CyaA–ACD are colored green and the side chains are colored light green. The main chains of EF are in blue and the side chains are sky-blue. Magnesium ions (red) and 3′dATP are from the EF–CaM complex.
Figure 6
Figure 6
Catalytic activation of CyaA. (A) Structural comparison of CyaA–ACD and the switch regions of EF. The structure of CyaA–ACD is aligned with EF by the CA domain (green). The C-CaM is colored red. The switch A, B, C of EF and the corresponding regions of CyaA are colored blue, orange, and cyan, respectively. The catalytic loop of CyaA–ACD and its contact with the C-terminal tail of CyaA–ACD are highlighted (right). The corresponding switch B and switch C regions of EF are shown for comparison (right). The atoms, carbon, oxygen, and nitrogen, are gray, red, and blue, respectively. The accession number for CaM-bound EF–ACD in complex with 2′d′3ANT-ATP is 1LVC. (B) The activation of CyaA–ACD and its mutants, N304A and F306A, by CaM at 10 μM free Ca2+ concentration. (C) Equilibrium titration of 2′d 3′ANT–ATP with CaM-bound CyaA–ACD and its mutants, N304A and F306A.
Figure 7
Figure 7
Comparison of the interactions of CaM with its effectors. (A) Representative structures of CaM in complex with its effectors. N-CaM is colored orange and C-CaM red. The segment from CaM effectors is colored purple and the second molecule of the dimer of CaM effectors is cyan. The protein data bank accession numbers, 1CDL, 1IWQ, 1L7Z, 1NWD, 1G4Y, and 1YRT, for CaM in complex with MLCK, MARCKS, CAP-23/NAP-22, GAD, calcium-activated small-conductance potassium channel (SK2), and CyaA, respectively. (B) Comparison of the interaction of C-CaM with the H helix of CyaA–ACD and the amphipathic α-helix of MLCK. The helices of CaM are colored red and the atoms, carbon, oxygen, nitrogen, and sulfur, are gray, red, blue, and yellow, respectively. (C) Interaction of CaM with its effectors. Sequence and secondary structure of the C-terminal of CaM are shown on the top. The Ca2+-binding sites are marked and Ca2+-binding residues are colored red. Boxes beneath the sequence of C-CaM indicate the contact area of each residue in the various structures, using the same coloring scheme as in Figure 4C. The Protein Data Bank codes for the structures are 1CKK, 1CDM, 1IQ5, and 1K90 for CaM in complex with CaM kinase I (CaMKI), CaM kinase II (CaMKII), CaM kinase kinase (CaMKK), and EF, respectively. Helix designations above the CaM sequence are based on the 1CLL CaM structure.

References

    1. Abrami L, Reig N, van der Goot FG (2005) Anthrax toxin: the long and winding road that leads to the kill. Trends Microbiol 13: 72–78 - PubMed
    1. Berridge MJ, Bootman MD, Roderick HL (2003) Calcium signalling: dynamics, homeostasis and remodelling. Nat Rev Mol Cell Biol 4: 517–529 - PubMed
    1. Bhattacharya S, Bunick CG, Chazin WJ (2004) Target selectivity in EF-hand calcium binding proteins. Biochim Biophys Acta 1742: 69–79 - PubMed
    1. Bouhss A, Krin E, Munier H, Gilles AM, Danchin A, Glaser P, Barzu O (1993) Cooperative phenomena in binding and activation of Bordetella pertussis adenylate cyclase by calmodulin. J Biol Chem 268: 1690–1694 - PubMed
    1. Brunger AT, Adams PD, Clore GM, DeLano WL, Gros P, Grosse-Kunstleve RW, Jiang JS, Kuszewski J, Nilges M, Pannu NS, Read RJ, Rice LM, Simonson T, Warren GL (1998) Crystallography & NMR system: a new software suite for macromolecular structure determination. Acta Crystallogr D Biol Crystallogr 54: 905–921 - PubMed

Publication types

MeSH terms