

Integration targeting by avian sarcoma-leukosis virus and human immunodeficiency virus in the chicken genome
- PMID: 16140779
- PMCID: PMC1212630
- DOI: 10.1128/JVI.79.18.12035-12044.2005
Integration targeting by avian sarcoma-leukosis virus and human immunodeficiency virus in the chicken genome
Abstract
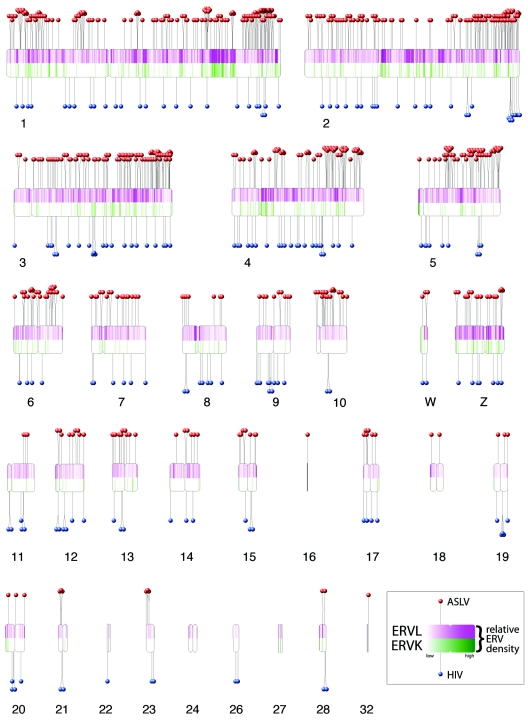
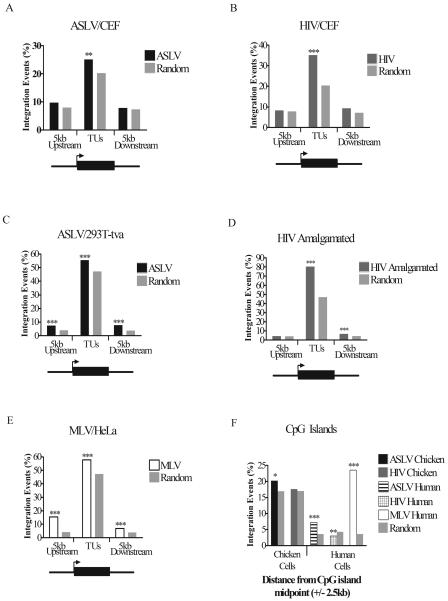
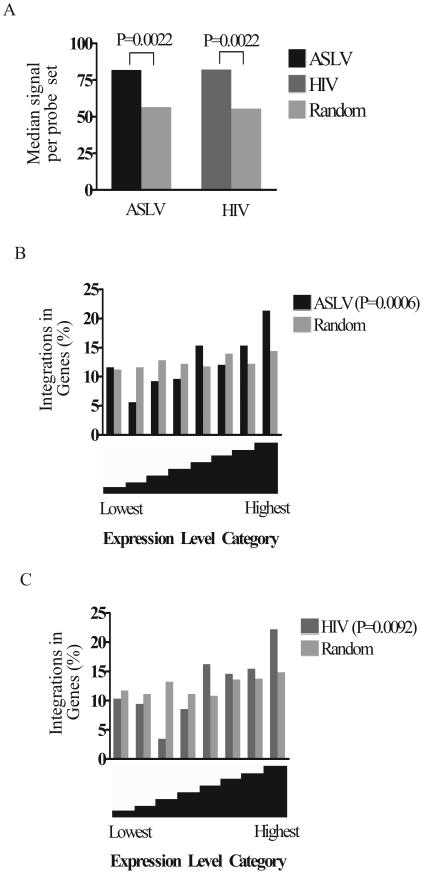
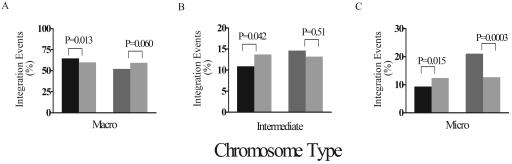
We have analyzed the placement of sites of integration of avian sarcoma-leukosis virus (ASLV) and human immunodeficiency virus (HIV) DNA in the draft chicken genome sequence, with the goals of assessing species-specific effects on integration and allowing comparison to the distribution of chicken endogenous retroviruses (ERVs). We infected chicken embryo fibroblasts (CEF) with ASLV or HIV and sequenced 863 junctions between host and viral DNA. The relationship with cellular gene activity was analyzed by transcriptional profiling of uninfected or ASLV-infected CEF cells. ASLV weakly favored integration in active transcription units (TUs), and HIV strongly favored active TUs, trends seen previously for integration in human cells. The ERVs, in contrast, accumulated mostly outside TUs, including ERVs related to ASLV. The minority of ERVs present within TUs were mainly in the antisense orientation; consequently, the viral splicing and polyadenylation signals would not disrupt cellular mRNA synthesis. In contrast, de novo ASLV integration sites within TUs showed no orientation bias. Comparing the distribution of de novo ASLV integration sites to ERVs indicated that purifying selection against gene disruption, and not initial integration targeting, probably determined the ERV distribution. Further analysis indicated that ERVs in humans, mice, and rats showed similar distributions, suggesting purifying selection dictated their distributions as well.
Figures
References
-
- Barbulescu, M., G. Turner, M. I. Seaman, A. S. Deinard, K. K. Kidd, and J. Lenz. 1999. Many human endogenous retrovirus K (HERV-K) proviruses are unique to humans. Curr. Biol. 26:861-868. - PubMed
-
- Belshaw, R., A. Katzourakis, J. Paces, A. Burt, and M. Tristem. 2005. High copy number in human endogeneous retrovirus families is associated with copying mechanisms in addition to reinfection. Mol. Biol. Evol. 22:814-817. - PubMed
-
- Boeke, J. D., and S. E. Devine. 1998. Yeast retrotransposons: finding a nice quiet neighborhood. Cell 93:1087-1089. - PubMed
-
- Borisenko, L., and A. Rynditch. 2004. Complete nucleotide sequences of ALV-related endogenous retroviruses available from the draft chicken genome sequence. Folia Biologica (Prague) 50:136-141. - PubMed
Publication types
MeSH terms
Substances
Associated data
- Actions
- Actions
- Actions
- Actions
- Actions
- Actions
- Actions
- Actions
- Actions
- Actions
- Actions
- Actions
- Actions
- Actions
- Actions
- Actions
- Actions
- Actions
- Actions
- Actions
- Actions
- Actions
- Actions
- Actions
- Actions
- Actions
- Actions
- Actions
- Actions
- Actions
- Actions
- Actions
- Actions
- Actions
- Actions
- Actions
- Actions
- Actions
- Actions
- Actions
- Actions
- Actions
- Actions
- Actions
- Actions
- Actions
- Actions
- Actions
- Actions
- Actions
- Actions
- Actions
- Actions
- Actions
- Actions
- Actions
- Actions
- Actions
- Actions
- Actions
- Actions
- Actions
- Actions
- Actions
- Actions
- Actions
- Actions
- Actions
- Actions
- Actions
- Actions
- Actions
- Actions
- Actions
- Actions
- Actions
- Actions
- Actions
- Actions
- Actions
- Actions
- Actions
- Actions
- Actions
- Actions
- Actions
- Actions
- Actions
- Actions
- Actions
- Actions
- Actions
- Actions
- Actions
- Actions
- Actions
- Actions
- Actions
- Actions
- Actions
- Actions
- Actions
- Actions
- Actions
- Actions
- Actions
- Actions
- Actions
- Actions
- Actions
- Actions
- Actions
- Actions
- Actions
- Actions
- Actions
- Actions
- Actions
- Actions
- Actions
- Actions
- Actions
- Actions
- Actions
- Actions
- Actions
- Actions
- Actions
- Actions
- Actions
- Actions
- Actions
- Actions
- Actions
- Actions
- Actions
- Actions
- Actions
- Actions
- Actions
- Actions
- Actions
- Actions
- Actions
- Actions
- Actions
- Actions
- Actions
- Actions
- Actions
- Actions
- Actions
- Actions
- Actions
- Actions
- Actions
- Actions
- Actions
- Actions
- Actions
- Actions
- Actions
- Actions
- Actions
- Actions
- Actions
- Actions
- Actions
- Actions
- Actions
- Actions
- Actions
- Actions
- Actions
- Actions
- Actions
- Actions
- Actions
- Actions
- Actions
- Actions
- Actions
- Actions
- Actions
- Actions
- Actions
- Actions
- Actions
- Actions
- Actions
- Actions
- Actions
- Actions
- Actions
- Actions
- Actions
- Actions
- Actions
- Actions
- Actions
- Actions
- Actions
- Actions
- Actions
- Actions
- Actions
- Actions
- Actions
- Actions
- Actions
- Actions
- Actions
- Actions
- Actions
- Actions
- Actions
- Actions
- Actions
- Actions
- Actions
- Actions
- Actions
- Actions
- Actions
- Actions
- Actions
- Actions
- Actions
- Actions
- Actions
- Actions
- Actions
- Actions
- Actions
- Actions
- Actions
- Actions
- Actions
- Actions
- Actions
- Actions
- Actions
- Actions
- Actions
- Actions
- Actions
- Actions
- Actions
- Actions
- Actions
- Actions
- Actions
- Actions
- Actions
- Actions
- Actions
- Actions
- Actions
- Actions
- Actions
- Actions
- Actions
- Actions
- Actions
- Actions
- Actions
- Actions
- Actions
- Actions
- Actions
- Actions
- Actions
- Actions
- Actions
- Actions
- Actions
- Actions
- Actions
- Actions
- Actions
- Actions
- Actions
- Actions
- Actions
- Actions
- Actions
- Actions
- Actions
- Actions
- Actions
- Actions
- Actions
- Actions
- Actions
- Actions
- Actions
- Actions
- Actions
- Actions
- Actions
- Actions
- Actions
- Actions
- Actions
- Actions
- Actions
- Actions
- Actions
- Actions
- Actions
- Actions
- Actions
- Actions
- Actions
- Actions
- Actions
- Actions
- Actions
- Actions
- Actions
- Actions
- Actions
- Actions
- Actions
- Actions
- Actions
- Actions
- Actions
- Actions
- Actions
- Actions
- Actions
- Actions
- Actions
- Actions
- Actions
- Actions
- Actions
- Actions
- Actions
- Actions
- Actions
- Actions
- Actions
- Actions
- Actions
- Actions
- Actions
- Actions
- Actions
- Actions
- Actions
- Actions
- Actions
- Actions
- Actions
- Actions
- Actions
- Actions
- Actions
- Actions
- Actions
- Actions
- Actions
- Actions
- Actions
- Actions
- Actions
- Actions
- Actions
- Actions
- Actions
- Actions
- Actions
- Actions
- Actions
- Actions
- Actions
- Actions
- Actions
- Actions
- Actions
- Actions
- Actions
- Actions
- Actions
- Actions
- Actions
- Actions
- Actions
- Actions
- Actions
- Actions
- Actions
- Actions
- Actions
- Actions
- Actions
- Actions
- Actions
- Actions
- Actions
- Actions
- Actions
- Actions
- Actions
- Actions
- Actions
- Actions
- Actions
- Actions
- Actions
- Actions
- Actions
- Actions
- Actions
- Actions
- Actions
- Actions
- Actions
- Actions
- Actions
- Actions
- Actions
- Actions
- Actions
- Actions
- Actions
- Actions
- Actions
- Actions
- Actions
- Actions
- Actions
- Actions
- Actions
- Actions
- Actions
- Actions
- Actions
- Actions
- Actions
- Actions
- Actions
- Actions
- Actions
- Actions
- Actions
- Actions
- Actions
- Actions
- Actions
- Actions
- Actions
- Actions
- Actions
- Actions
- Actions
- Actions
- Actions
- Actions
- Actions
- Actions
- Actions
- Actions
- Actions
- Actions
- Actions
- Actions
- Actions
- Actions
- Actions
- Actions
- Actions
- Actions
- Actions
- Actions
- Actions
- Actions
- Actions
- Actions
- Actions
- Actions
- Actions
- Actions
- Actions
- Actions
- Actions
- Actions
- Actions
- Actions
- Actions
- Actions
- Actions
- Actions
- Actions
- Actions
- Actions
- Actions
- Actions
- Actions
- Actions
- Actions
- Actions
- Actions
- Actions
- Actions
- Actions
- Actions
- Actions
- Actions
- Actions
- Actions
- Actions
- Actions
- Actions
- Actions
- Actions
- Actions
- Actions
- Actions
- Actions
- Actions
- Actions
- Actions
- Actions
- Actions
- Actions
- Actions
- Actions
- Actions
- Actions
- Actions
- Actions
- Actions
- Actions
- Actions
- Actions
- Actions
- Actions
- Actions
- Actions
- Actions
- Actions
- Actions
- Actions
- Actions
- Actions
- Actions
- Actions
- Actions
- Actions
- Actions
- Actions
- Actions
- Actions
- Actions
- Actions
- Actions
- Actions
- Actions
- Actions
- Actions
- Actions
- Actions
- Actions
- Actions
- Actions
- Actions
- Actions
- Actions
- Actions
- Actions
- Actions
- Actions
- Actions
- Actions
- Actions
- Actions
- Actions
- Actions
- Actions
- Actions
- Actions
- Actions
- Actions
- Actions
- Actions
- Actions
- Actions
- Actions
- Actions
- Actions
- Actions
- Actions
- Actions
- Actions
- Actions
- Actions
- Actions
- Actions
- Actions
- Actions
- Actions
- Actions
- Actions
- Actions
- Actions
- Actions
- Actions
- Actions
- Actions
- Actions
- Actions
- Actions
- Actions
- Actions
- Actions
- Actions
- Actions
- Actions
- Actions
- Actions
- Actions
- Actions
- Actions
- Actions
- Actions
- Actions
- Actions
- Actions
- Actions
- Actions
- Actions
- Actions
- Actions
- Actions
- Actions
- Actions
- Actions
- Actions
- Actions
- Actions
- Actions
- Actions
- Actions
- Actions
- Actions
- Actions
- Actions
- Actions
- Actions
- Actions
- Actions
- Actions
- Actions
- Actions
- Actions
- Actions
- Actions
- Actions
- Actions
- Actions
- Actions
- Actions
- Actions
- Actions
- Actions
- Actions
- Actions
- Actions
- Actions
- Actions
- Actions
- Actions
- Actions
- Actions
- Actions
- Actions
- Actions
- Actions
- Actions
- Actions
- Actions
- Actions
- Actions
- Actions
- Actions
- Actions
- Actions
- Actions
- Actions
- Actions
- Actions
- Actions
- Actions
- Actions
- Actions
- Actions
- Actions
- Actions
- Actions
- Actions
- Actions
- Actions
- Actions
- Actions
- Actions
- Actions
- Actions
- Actions
- Actions
- Actions
- Actions
- Actions
- Actions
- Actions
- Actions
- Actions
- Actions
- Actions
- Actions
- Actions
- Actions
- Actions
- Actions
- Actions
- Actions
- Actions
- Actions
- Actions
- Actions
- Actions
- Actions
- Actions
- Actions
- Actions
- Actions
- Actions
- Actions
- Actions
- Actions
- Actions
- Actions
- Actions
- Actions
- Actions
- Actions
- Actions
- Actions
- Actions
- Actions
- Actions
- Actions
- Actions
- Actions
- Actions
- Actions
- Actions
- Actions
- Actions
- Actions
- Actions
- Actions
- Actions
- Actions
- Actions
- Actions
- Actions
- Actions
- Actions
- Actions
- Actions
- Actions
- Actions
- Actions
- Actions
- Actions
- Actions
- Actions
- Actions
- Actions
- Actions
- Actions
- Actions
- Actions
- Actions
- Actions
- Actions
- Actions
- Actions
- Actions
- Actions
- Actions
- Actions
- Actions
- Actions
- Actions
- Actions
- Actions
- Actions
- Actions
- Actions
- Actions
- Actions
- Actions
- Actions
- Actions
- Actions
- Actions
- Actions
- Actions
- Actions
- Actions
- Actions
- Actions
- Actions
- Actions
- Actions
- Actions
- Actions
- Actions
- Actions
- Actions
- Actions
- Actions
- Actions
- Actions
- Actions
- Actions
- Actions
- Actions
- Actions
- Actions
- Actions
- Actions
- Actions
- Actions
- Actions
- Actions
- Actions
- Actions
- Actions
- Actions
- Actions
- Actions
- Actions
- Actions
- Actions
- Actions
- Actions
- Actions
- Actions
- Actions
- Actions
- Actions
- Actions
- Actions
- Actions
- Actions
- Actions
- Actions
- Actions
Grants and funding
LinkOut - more resources
Full Text Sources
Other Literature Sources
