

doi: 10.1128/JVI.79.18.12117-12121.2005.
Sustained CD8+ T-cell responses induced after acute parvovirus B19 infection in humans
Affiliations
- PMID: 16140790
- PMCID: PMC1212640
- DOI: 10.1128/JVI.79.18.12117-12121.2005
Item in Clipboard
Sustained CD8+ T-cell responses induced after acute parvovirus B19 infection in humans
J Virol.
2005 Sep.
Abstract
Murine models have suggested that CD8+ T-cell responses peak early in acute viral infections and are not sustained, but no evidence for humans has been available. To address this, we longitudinally analyzed the CD8+ T-cell response to human parvovirus B19 in acutely infected individuals. We observed striking CD8+ T-cell responses, which were sustained or even increased over many months after the resolution of acute disease, indicating that CD8+ T cells may play a prominent role in the control of parvovirus B19 and other acute viral infections of humans, including potentially those generated by live vaccines.
Figures
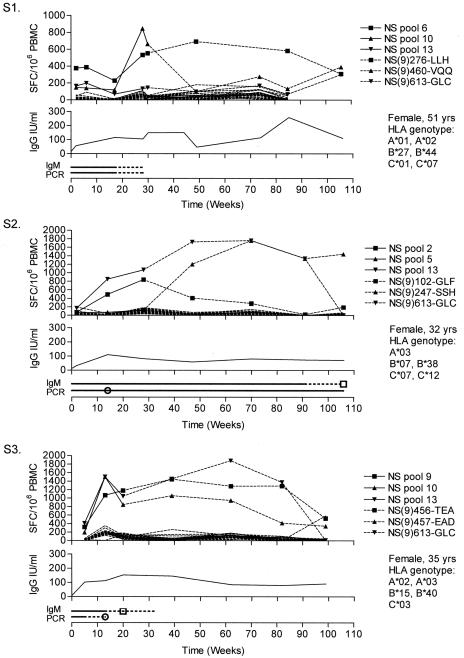
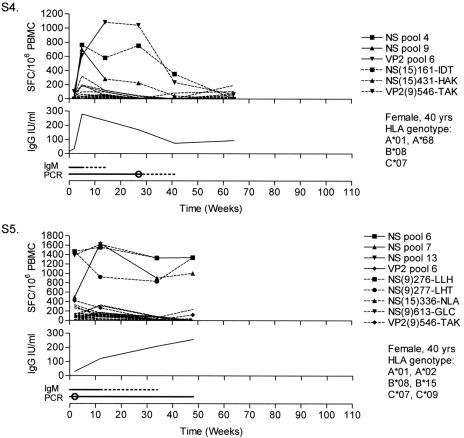
Longitudinal ELISpot, serology, and PCR data. Each graph is composed of three panels. The upper panel shows the IFN-γ responses over time expressed as SFC/106 PBMC. Solid lines with symbols represent positive peptide pool responses that were further mapped and are replaced at later time points by the responses to single peptides or nonamers, represented by dashed lines with the corresponding symbols. Dashed lines without symbols represent responses to the other peptide pools. For plotted responses to overlapping 15-mers (S4), responses to both peptides were equal, and only the second is plotted for clarity. For readability, error bars are not plotted, but mean standard deviations ± 95% confidence interval of positive triplicates were 58 ± 22, 53 ± 27, 46 ± 22, 37 ± 14, and 30 ± 18 SFC/106 PBMC for S1 through S5, respectively. The middle panel shows the IgG levels over time expressed in international units (IU) per ml. In the lower panel, the IgM serology is shown above the PCR results. A solid line was drawn between positive samples, and a dashed line represents time between a positive and negative result (or intermediate). Squares mark intermediate IgM serology results. Circles mark the time points when B19 DNA was lost in serum; further positivity then represents detectable viral DNA in PBMC. SFC, spot-forming cells.
Longitudinal ELISpot, serology, and PCR data. Each graph is composed of three panels. The upper panel shows the IFN-γ responses over time expressed as SFC/106 PBMC. Solid lines with symbols represent positive peptide pool responses that were further mapped and are replaced at later time points by the responses to single peptides or nonamers, represented by dashed lines with the corresponding symbols. Dashed lines without symbols represent responses to the other peptide pools. For plotted responses to overlapping 15-mers (S4), responses to both peptides were equal, and only the second is plotted for clarity. For readability, error bars are not plotted, but mean standard deviations ± 95% confidence interval of positive triplicates were 58 ± 22, 53 ± 27, 46 ± 22, 37 ± 14, and 30 ± 18 SFC/106 PBMC for S1 through S5, respectively. The middle panel shows the IgG levels over time expressed in international units (IU) per ml. In the lower panel, the IgM serology is shown above the PCR results. A solid line was drawn between positive samples, and a dashed line represents time between a positive and negative result (or intermediate). Squares mark intermediate IgM serology results. Circles mark the time points when B19 DNA was lost in serum; further positivity then represents detectable viral DNA in PBMC. SFC, spot-forming cells.
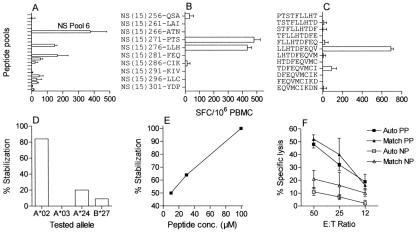
Example of the mapping and characterization of an epitope. The mapping and characterization of the epitope NS(9)247-LLH in S1 are shown. (A) The ELISpot IFN-γ responses to all NS peptide pools at week 2 are plotted. (B) Further mapping of the response to NS pool 6 revealed responses directed to two overlapping single 15-mers. SFC, spot-forming cells. (C) Testing of nonamers covering the sequence of the two reactive 15-mers revealed the epitope located in the overlap. (D) HLA restriction was confirmed by showing the epitope capable of stabilizing major histocompatibility complex (MHC) of T2 cells expressing HLA-A*02 but not MHC of cells with different expression. Peptide concentration was 30 μM. (E) An increasing peptide concentration (conc.) resulted in increasing stabilization of MHC of HLA-A*02-positive T2 cells. (F) Specific lysis in a 51Cr-release assay in which target cells were either pulsed (PP) or not pulsed (NP) with the epitope. In addition to autologous (Auto) targets, the HLA-A*02 restriction was confirmed by showing lysis of A*02 single matched target cells (Match). Error bars equal 1 standard deviation of triplicates where available. E:T ratio, effector-to-target cell ratio.
References
-
- Addo, M. M., X. G. Yu, A. Rathod, D. Cohen, R. L. Eldridge, D. Strick, M. N. Johnston, C. Corcoran, A. G. Wurcel, C. A. Fitzpatrick, M. E. Feeney, W. R. Rodriguez, N. Basgoz, R. Draenert, D. R. Stone, C. Brander, P. J. Goulder, E. S. Rosenberg, M. Altfeld, and B. D. Walker. 2003. Comprehensive epitope analysis of human immunodeficiency virus type 1 (HIV-1)-specific T-cell responses directed against the entire expressed HIV-1 genome demonstrate broadly directed responses, but no correlation to viral load. J. Virol. 77:2081-2092. - PMC - PubMed
-
- Appay, V., P. R. Dunbar, M. Callan, P. Klenerman, G. M. Gillespie, L. Papagno, G. S. Ogg, A. King, F. Lechner, C. A. Spina, S. Little, D. V. Havlir, D. D. Richman, N. Gruener, G. Pape, A. Waters, P. Easterbrook, M. Salio, V. Cerundolo, A. J. McMichael, and S. L. Rowland-Jones. 2002. Memory CD8+ T cells vary in differentiation phenotype in different persistent virus infections. Nat. Med. 8:379-385. - PubMed
-
- Badovinac, V. P., B. B. Porter, and J. T. Harty. 2002. Programmed contraction of CD8(+) T cells after infection. Nat. Immunol. 3:619-626. - PubMed
-
- Franssila, R., and K. Hedman. 2004. T-helper cell-mediated interferon-gamma, interleukin-10 and proliferation responses to a candidate recombinant vaccine for human parvovirus B19. Vaccine 22:3809-3815. - PubMed
-
- Franssila, R., K. Hokynar, and K. Hedman. 2001. T helper cell-mediated in vitro responses of recently and remotely infected subjects to a candidate recombinant vaccine for human parvovirus b19. J. Infect. Dis. 183:805-809. - PubMed
Publication types
MeSH terms
Substances
LinkOut - more resources
Full Text Sources
Research Materials
