. 2005 Nov 15;569(Pt 1):41-57.
doi: 10.1113/jphysiol.2005.095042. Epub 2005 Sep 1.

Kv4 potassium channel subunits control action potential repolarization and frequency-dependent broadening in rat hippocampal CA1 pyramidal neurones

Affiliations

Kv4 potassium channel subunits control action potential repolarization and frequency-dependent broadening in rat hippocampal CA1 pyramidal neurones

Jinhyun Kim et al. J Physiol. .

Abstract

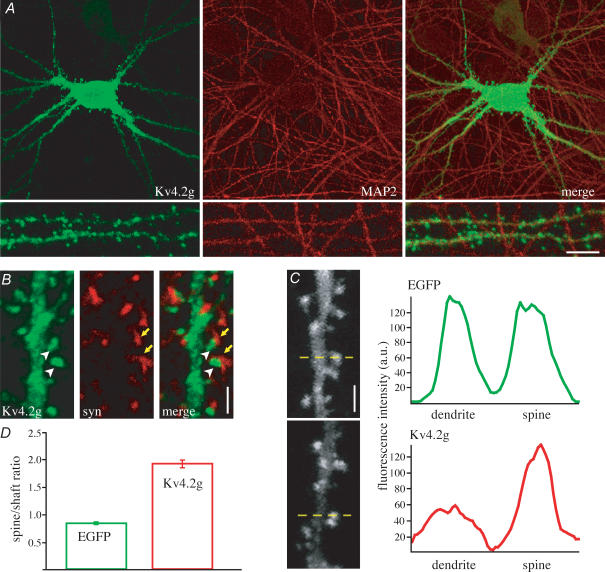
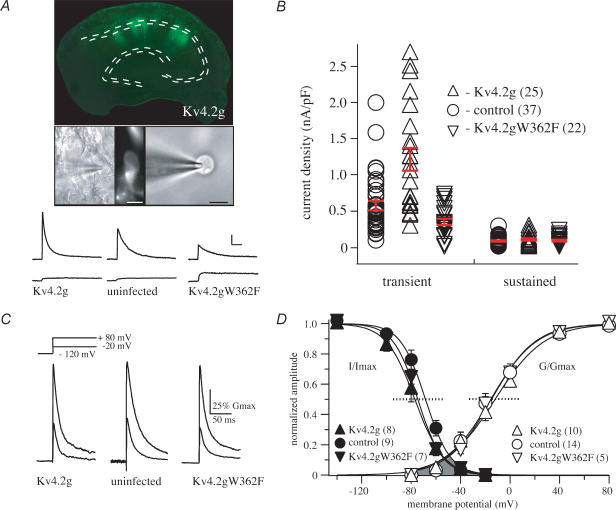
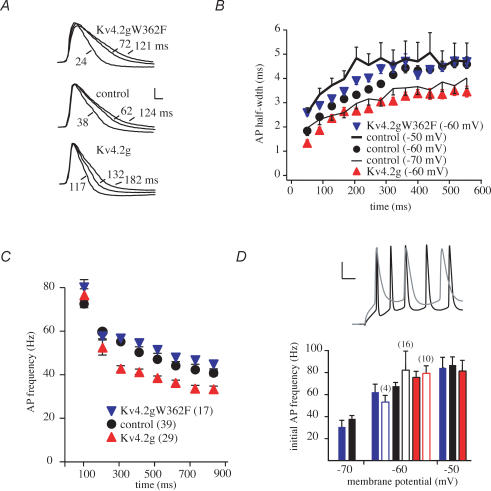
A-type potassium channels regulate neuronal firing frequency and the back-propagation of action potentials (APs) into dendrites of hippocampal CA1 pyramidal neurones. Recent molecular cloning studies have found several families of voltage-gated K(+) channel genes expressed in the mammalian brain. At present, information regarding the relationship between the protein products of these genes and the various neuronal functions performed by voltage-gated K(+) channels is lacking. Here we used a combination of molecular, electrophysiological and imaging techniques to show that one such gene, Kv4.2, controls AP half-width, frequency-dependent AP broadening and dendritic action potential propagation. Using a modified Sindbis virus, we expressed either the enhanced green fluorescence protein (EGFP)-tagged Kv4.2 or an EGFP-tagged dominant negative mutant of Kv4.2 (Kv4.2g(W362F)) in CA1 pyramidal neurones of organotypic slice cultures. Neurones expressing Kv4.2g(W362F) displayed broader action potentials with an increase in frequency-dependent AP broadening during a train compared with control neurones. In addition, Ca(2)(+) imaging of Kv4.2g(W362F) expressing dendrites revealed enhanced AP back-propagation compared to control neurones. Conversely, neurones expressing an increased A-type current through overexpression of Kv4.2 displayed narrower APs with less frequency dependent broadening and decreased dendritic propagation. These results point to Kv4.2 as the major contributor to the A-current in hippocampal CA1 neurones and suggest a prominent role for Kv4.2 in regulating AP shape and dendritic signalling. As Ca(2)(+) influx occurs primarily during AP repolarization, Kv4.2 activity can regulate cellular processes involving Ca(2)(+)-dependent second messenger cascades such as gene expression and synaptic plasticity.


Figures

Figure 1
Figure 1. Somatodendritic expression and spine enrichment of Kv4.2g in cultured hippocampal neurones
A, attenuated Sindbis virus-mediated expression of Kv4.2g, detected by EGFP fluorescence, shows a somatodendritic distribution (left top) and is found in spines (left bottom). Most EGFP-positive spiny dendritic processes overlapped with MAP2-positive dendrites (right). No thin, axon-like processes were detected in Kv4.2g-expressing neurones. Scale bar: 8 μm. B, dual immunolabelling of Kv4.2g (white arrowhead) and the presynaptic marker synaptophysin (syn, yellow arrow), indicates postsynaptic expression of Kv4.2g. Scale bar: 4 μm. C, representative linear plot analysis of a dendritic shaft and spine. Comparison of the relative fluorescence intensity between dendritic shaft and spine showed that Kv4.2g was enriched in spines compared with EGFP alone. a.u., arbitrary units. Scale bar: 4 μm. D, summarized ratio of fluorescence intensity in spines relative to that in the adjacent dendritic shaft.
Figure 2
Figure 2. Nucleated and outside-out patch recordings from organotypic slice cultures
A, top, Kv4.2g fluorescence in CA1 neurones was imaged 1 day after infection; middle, high-powered IR-DIC image of a CA1 neurone with recording pipette; middle image shows the EGFP fluorescence of the same cell; right panel shows a nucleated patch. Scale bars: 10 μm. Bottom, representative voltage-isolated transient (top) and sustained outward currents (bottom) from Kv4.2g, uninfected and Kv4.2gW362F-expressing neurones for voltage step from −120 to +60 mV. TTX (1 μm) was included in the bath to block Na+ channels. Scale bar: 200 pA, 10 ms. B, transient and sustained peak current density per patch for Kv4.2g (▵), Kv4.2gW362F (▿), and control (uninfected or EGFP-expressing) neurones (○). C, isolated transient currents from nucleated patches from each experimental group for voltage steps from −120 to −20 and +80 mV. Each pair of traces was scaled to a normalized peak conductance. D, steady-state activation and inactivation curves for Kv4.2g, uninfected and Kv4.2gW362F patches. Half-activation and inactivation voltages were not significantly different between groups. Numbers in parentheses indicate n values for inactivation and activation curves. Shaded grey area indicates the standing window current expected in uninfected cells.
Figure 3
Figure 3. Kv4.2 activity affects cellular input resistance
A, subthreshold voltage transients generated in response to 900 ms current injections for Kv4.2g (red traces) and control neurones (black traces). Current injections were −200, −150, −100, −50, +50 and +100 pA. Smaller voltage responses are seen in the Kv4.2g cell for all injections. APs were initiated in the control cell in response to the +100 pA current injection (trace clipped for presentation) but not in Kv4.2-expressing cells. B and C, Current–voltage relationship for the peak (B) and steady-state (C) voltages for control cells (black circles), Kv4.2g- (red, up triangles), and Kv4.2gW362F-expressing cells (blue, down triangles). Lines are linear regressions of the data. Overexpressing Kv4.2 lowered Rin while decreasing Kv4.2 levels increased Rin. D, the difference potential or ‘sag’ between peak and steady-state voltages is plotted against the peak voltage. This relationship did not differ between experimental groups. Same symbols as in B. E, resistance (slope of the IV curve using the peak voltage) normalized to control at −60 mV, was dependent on resting potential (P < 0.05) in all groups and was increased with 4-AP (3–5 mm, P < 0.05).
Figure 4
Figure 4. Kv4.2 overexpression increases AP latency, AHP and threshold
A, the voltage responses to a 900 ms, 300 pA current injection in Kv4.2g (right traces), control (middle traces), and Kv4.2gW362F (left) neurones. Scale bar: 20 mV, 200 ms. B, time to first spike onset for control (black bar), Kv4.2g- (red bar), and Kv4.2gW362F (blue bar) -expressing neurones for a 300 pA current injection. Open bars show that 4-AP reduced latency. C, enlarged traces from A (control, black trace; Kv4.2g, red trace), with the first APs aligned. The first spike AHP was measured as the voltage difference between AP threshold (filled arrow) and the peak after-hyperpolarization voltage (open arrow). Below, grouped data for the first AP AHP in control (black bar), Kv4.2g- (red bar), and Kv4.2g-expressing neurones in 3–5 mm 4-AP (open bar). *P < 0.01 versus control; †P < 0.01 versus Kv4.2g. D, top trace, representation of the current ramp (250 pA s−1) used to determine AP threshold. Middle traces, the resulting voltages for a control neurone with normal (black trace) and 4-AP (grey trace) solutions. Scale bar: 20 mV, 100 ms. Bottom traces, same voltage traces as above aligned and magnified to illustrate threshold. Right, grouped AP threshold data. *P < 0.01 versus control; †P < 0.05 versus control; #P < 0.01 versus Kv4.2g.
Figure 5
Figure 5. Kv4.2 expression level affects AP half-width and firing frequency in CA1 neurones
A, traces are the voltage responses to a 900 ms, 300 pA current injection in Kv4.2g (bottom traces), control (middle traces), and Kv4.2gW362F (top) neurones at the indicated time during the train, aligned to illustrate half-width. Scale bar: 20 mV, 1 ms. B, AP half-width (binned, 50 ms) is plotted versus time during a 300 pA current injection. Kv4.2g (red triangles) -expressing cells showed decreased half-widths compared with control neurones (circles) while Kv4.2gW362F-expressing neurones (blue triangles) show broader APs. Lines illustrate the voltage dependency of AP half-width. C, firing frequency, calculated from the interspike interval (100 ms bins), plotted against time during a 300 pA current injection for each group. Number of cells in parentheses. D, firing frequency during the first 100 ms of the current injection. Top traces show 4-AP (grey trace) reduces AP frequency in a Kv4.2gW362F recording. Scale bar: 20 mV, 50 ms. Grouped data below show firing frequency over first 100 ms of a 300 pA current injection increases with depolarization (P < 0.05 for control and Kv4.2gW362F, too few APs were recorded at −70 mV in Kv4.2g-expressing neurones for evaluation) but is not significantly changed with 4-AP (3–5 mm, P > 0.05).
Figure 6
Figure 6. Kv4.2 contributes to frequency-dependent AP broadening in CA1 neurones
A, AP half-widths for each of 10 APs in a train induced at 10, 20, 50 and 100 Hz (left column) are normalized to the first AP of the train (right column) for Kv4.2g- (up triangles), control (circles), and Kv4.2gW362F- (down triangles) expressing neurones. Current protocol is shown above. B, Kv4.2g-expressing neurones show significantly reduced broadening between the first and second AP of the train at high frequencies. Traces are the first two action potentials of a 100 Hz train superimposed for each group. C, Kv4.2gW362F-overexpressing neurones show increased broadening of the tenth AP at high frequencies. At 100 Hz Kv4.2g also results in a broader AP at the end of the train. Traces are the first and tenth action potentials of a 100 Hz train aligned for each group. *P < 0.05.
Figure 7
Figure 7. Time course and frequency dependence of native transient current inactivation approximates frequency-dependent AP broadening in CA pyramidal neurones
A, outside-out patch recordings show repetitive activity decreases available transient K+ currents. To simulate trains of action potentials, trains of 10 depolarizing steps, 2 ms in duration, were delivered to outside-out patches at 10, 20, 50 and 100 Hz. TTX (1 μm) was included in the bath to block Na+ channels. Leak-subtracted ensemble average of currents show the amplitude of the 10th evoked current is significantly smaller than the amplitude of the first evoked current at 50 and 100 Hz. Scale bar: 10 pA, 100 ms. B, first and 10th evoked currents from A on expanded time base for 10 and 100 Hz. C, group data. To quantify the decrease in current amplitudes during the train, the amplitude of the current evoked by the 10th depolarizing step is plotted as a fraction of the amplitude of the current evoked by the first depolarizing step for each test frequency. Numbers in parentheses indicate the numbers of patches. For comparison, the thin lines represent 1/AP half-width for control neurones at each test frequency (Fig. 6). As expected, given their similar time course of recovery from inactivation (Table 1), Kv4.2g- and Kv4.2gW362F-expressing neurones displayed frequency and time-dependent inactivation not different from control, uninfected neurones (not shown).
Figure 8
Figure 8. Kv4.2 expression level determines dendritic AP-dependent Ca2+ transient amplitudes
A, pseudocolour image illustrating Ca2+ influx after three APs (100 Hz) for each experimental group. Triangles indicate somatic (open) and dendritic (150 μm, filled triangle) recording locations. Scale bar, 30 μm; colour scale values are arbitrary units. B, representative Ca2+ transients evoked by a single and trains of APs recorded from somas (left) and dendrites (150 μm, right) from uninfected (black trace), Kv4.2g- (red trace) and Kv4.2gW362F- (blue trace) expressing neurones. Scale bar, 2.5%ΔF/F, 5 ms. C, average peak Ca2+ transient for an AP recorded from somas and dendrites (150 μm). Numbers in parentheses are the n numbers. ***P < 0.01 peak Ca2+ difference between experimental group and uninfected neurones; †††P < 0.01 peak Ca2+ difference between soma and dendrites; †P < 0.05 peak Ca2+ difference between soma and dendrites. Attenuation of peak Ca2+ from soma to dendrite is not significant in Kv4.2gW362F neurones.

References

    1. Aldrich RW, Jr, Getting PA, Thompson SH. Mechanism of frequency-dependent broadening of molluscan neurone soma spikes. J Physiol. 1979;291:531–544. - PMC - PubMed
    1. Alonso G, Widmer H. Clustering of KV4.2 potassium channels in postsynaptic membrane of rat supraoptic neurons: an ultrastructural study. Neuroscience. 1997;77:617–621. - PubMed
    1. An WF, Bowlby MR, Betty M, Cao J, Ling HP, Mendoza G, Hinson JW, Mattsson KI, Strassle BW, Trimmer JS, Rhodes KJ. Modulation of A-type potassium channels by a family of calcium sensors. Nature. 2000;403:553–556. - PubMed
    1. Anderson AE, Adams JP, Qian Y, Cook RG, Pfaffinger PJ, Sweatt JD. Kv4.2 phosphorylation by cyclic AMP-dependent protein kinase. J Biol Chem. 2000;275:5337–5346. - PubMed
    1. Andreasen M, Lambert JD. Regenerative properties of pyramidal cell dendrites in area CA1 of the rat hippocampus. J Physiol. 1995;483:421–441. - PMC - PubMed

Publication types

LinkOut - more resources