. 2005 Sep 6;102(36):12837-42.
doi: 10.1073/pnas.0504609102. Epub 2005 Sep 2.

Significance analysis of time course microarray experiments

Affiliations

Significance analysis of time course microarray experiments

John D Storey et al. Proc Natl Acad Sci U S A. .

Abstract

Characterizing the genome-wide dynamic regulation of gene expression is important and will be of much interest in the future. However, there is currently no established method for identifying differentially expressed genes in a time course study. Here we propose a significance method for analyzing time course microarray studies that can be applied to the typical types of comparisons and sampling schemes. This method is applied to two studies on humans. In one study, genes are identified that show differential expression over time in response to in vivo endotoxin administration. By using our method, 7,409 genes are called significant at a 1% false-discovery rate level, whereas several existing approaches fail to identify any genes. In another study, 417 genes are identified at a 10% false-discovery rate level that show expression changing with age in the kidney cortex. Here it is also shown that as many as 47% of the genes change with age in a manner more complex than simple exponential growth or decay. The methodology proposed here has been implemented in the freely distributed and open-source edge software package.


Figures
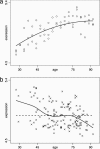
Fig. 1.
Fig. 1.
Example of independently sampled time course expression data. (a) Simulated example of a gene's expression measurements obtained by independent sampling. The solid line is the population average time curve and the open circles are observed expression values. (b) Expression values of a significant gene in the kidney aging study. The solid line is the curve fit under the alternative hypothesis of differential expression, and the dashed line is the curve fit under the null hypothesis of no differential expression. The × symbols represent observed expression values.
Fig. 2.
Fig. 2.
Example of longitudinally sampled time course expression data. (a) Simulated example of a gene's expression measurements obtained from longitudinal sampling of four individuals. The solid line is the population average time curve. The dashed lines are the average time curves for the individuals. The points of a common shape correspond to one of the individuals. (b) Expression values of a significant gene from the endotoxin study. The solid lines are the curves fit under the alternative hypothesis of differential expression, and the dashed line is the curve fit under the null hypothesis of no differential expression. The × symbols represent controls, and the open circles represent treated individuals.
Fig. 3.
Fig. 3.
Smoothed version of the top two eigen-genes obtained from probe sets significant at Q ≤ 0.1% in the endotoxin study. The solid lines are smoothers fit to endotoxin-treated individuals, and the dashed lines are fit to the control individuals. The first eigen-gene explains 66% of the variance and is represented by the black lines. The second eigen-gene explains 16% of the variance and is represented by the gray lines.
Fig. 4.
Fig. 4.
Functional analysis of genes found to be significant at Q ≤ 0.1% in the endotoxin study. Shown are representative functions differentially enriched [difference in log(significance) > 4] between the groups of up-regulated (light gray) and down-regulated (black) genes. The significance values of these functions in the combined group are shown in dark gray.

References

    1. Slonim, D. K. (2002) Nat. Genet. 32, 502-508. - PubMed
    1. Cui, X. & Churchill, G. A. (2003) Genome Biol. 4, 210. - PMC - PubMed
    1. Eisen, M. B., Spellman, P. T., Brown, P. O. & Botstein, D. (1998) Proc. Natl. Acad. Sci. USA 95, 14863-14868. - PMC - PubMed
    1. Zhu, G., Spellman, P. T., Volpe, T., Brown, P. O., Botstein, D., Davis, T. N. & Futcher, B. (2000) Nature 406, 90-94. - PubMed
    1. Alter, O., Brown, P. O. & Botstein, D. (2000) Proc. Natl. Acad. Sci. USA 97, 10101-10106. - PMC - PubMed

Publication types

Substances

LinkOut - more resources