. 2005 Sep 13;102(37):13170-5.
doi: 10.1073/pnas.0501672102. Epub 2005 Sep 2.

Sequential development of hematopoietic and cardiac mesoderm during embryonic stem cell differentiation

Affiliations

Sequential development of hematopoietic and cardiac mesoderm during embryonic stem cell differentiation

Valerie Kouskoff et al. Proc Natl Acad Sci U S A. .

Abstract

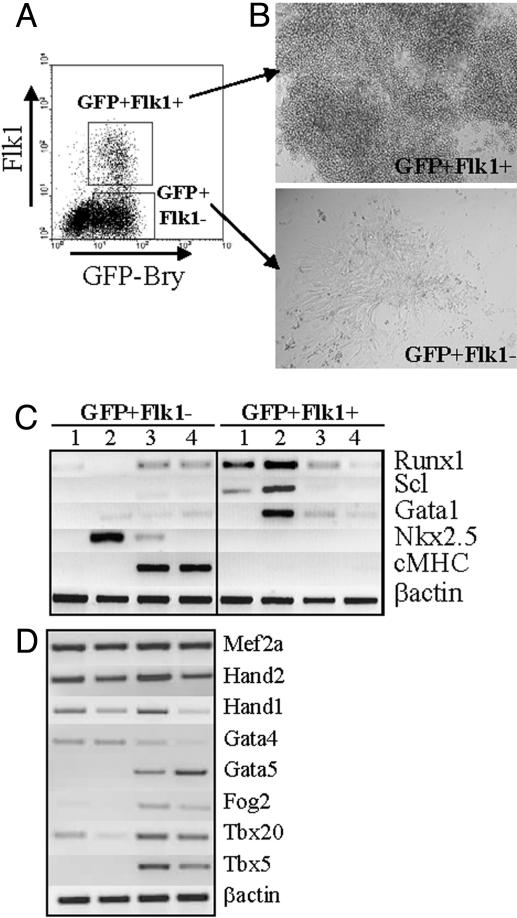
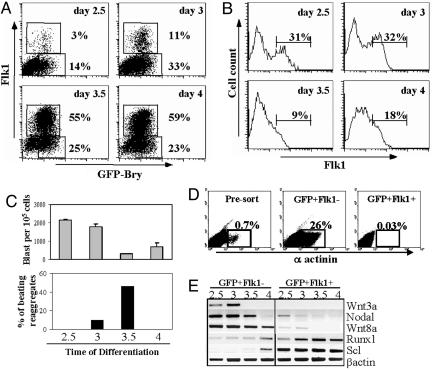
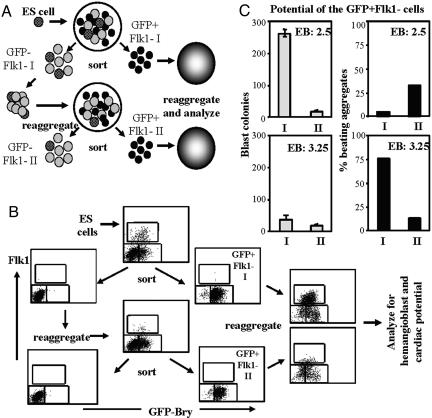
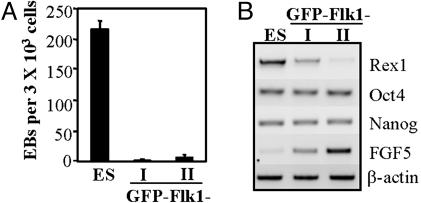
The ability to generate a wide spectrum of differentiated cell types from ES cells in culture offers a powerful approach for studying lineage induction and specification and a promising source of progenitors for cell replacement therapy. Although significant efforts are being made to optimize culture conditions for the generation of different cell populations from ES cells, the identification and efficient isolation of specific progenitors for many lineages within these cultures remains a major challenge. By specifically tracking hematopoietic and cardiac development, we demonstrate here that these two lineages arise from distinct mesoderm subpopulations that develop in sequential waves from pre-mesoderm cells. Access to these populations provides a unique approach to isolate and characterize the earliest progenitors of these lineages.


Figures

Fig. 1.
Fig. 1.
Cardiomyocyte potential of the GFP+Flk and GFP+Flk1+ fractions. (A) At day 3.25 of differentiation, cells from GFP-Bry EBs were fractionated by cell sorting based on their respective levels of GFP and Flk1 expression. (B) Cells from both fractions were allowed to reaggregate in serum-free conditions for 20 h. Then, EB-like aggregates that formed were cultured on gelatin-coated dishes for several days. Representative colonies generated from aggregates from each fraction are shown. (C) Expression analysis of: freshly isolated GFP+Flk and GFP+Flk1+ cells (lane 1), aggregates generated from the sorted cells (lane 2), and cells from aggregates cultured for 2 (lane 3) or 4 (lane 4) days. Data are representative of three independent experiments. (D) Expression analysis of genes implicated in cardiomyocyte development performed on the same GFP+Flk fractions as in lanes 1–4 in C. Data are representative of three independent experiments.
Fig. 2.
Fig. 2.
Hemangioblast and cardiac potential of mesoderm subpopulations isolated at different stages of EB differentiation. (A) At the indicated day of differentiation, GFP-Bry EBs were harvested and dissociated, and the cells were isolated by sorting based on their respective levels of GFP and Flk1 expression. (B) Flk1 expression of cells within aggregates generated from each of the isolated GFP+Flk subpopulations. (C) BL-CFC potential (gray bars) of aggregates derived from the different GFP+Flk populations. Blast colonies, the progeny of the BL-CFCs, were scored after 4 days of culture. The cardiac potential (black bars) of the aggregates from each of the GFP+Flk fractions was also determined. Aggregates were individually deposited into 96-well plates (48 aggregates per time point). The proportion of aggregates with beating cells was scored 4 days later. (D) α-Actinin staining 4 days after reaggregation. Although α-actinin (sarcomeric) stains both cardiac and skeletal muscle cells, no skeletal myosin staining was detected in the aggregates (data not shown). (E) Expression analysis of freshly isolated GFP+Flk and GFP+Flk1+ cells from each time point. Data are representative of four independent experiments.
Fig. 3.
Fig. 3.
Developmental potential of sequential waves of mesoderm. (A) Schematic representation of the experimental procedure used to generate successive waves of mesoderm (GFP+Flk I and GFP+Flk II) from GFP-negative cell populations (GFPFlk I and GFPFlk II). (B) FACS profiles of the different populations from a typical experiment initiated from EBs at day 2.5 of differentiation. Each subpopulation was analyzed for expression of GFP and Flk1. (C) BL-CFC (gray bars) and cardiac (black bars) potential of the GFP+Flk I and GFP+Flk II populations derived from EBs harvested either at day 2.5 or 3.25 of differentiation. Cardiac potential was evaluated from the culture of individual aggregates in microtiter wells. Forty-eight aggregates were analyzed for each subpopulation. Data are representative of three independent experiments.
Fig. 4.
Fig. 4.
Analysis of the GFPFlk subpopulations. (A) Undifferentiated ES cells and cells from GFPFlk I and GFPFlk II populations were tested for their ability to generate secondary EBs in methylcellulose cultures. Secondary EBs were scored after 6 days of culture. (B) Comparative gene expression analysis of ES cells and the two GFPFlk populations.

References

    1. Smith, A. G. (2001) Annu. Rev. Cell Dev. Biol. 17, 435–462. - PubMed
    1. Keller, G. M. (1995) Curr. Opin. Cell Biol. 7, 862–869. - PubMed
    1. Keller, G., Kennedy, M., Papayannopoulou, T. & Wiles, M. V. (1993) Mol. Cell. Biol. 13, 473–486. - PMC - PubMed
    1. Vittet, D., Prandini, M. H., Berthier, R., Schweitzer, A., Martin-Sisteron, H., Uzan, G. & Dejana, E. (1996) Blood 88, 3424–3431. - PubMed
    1. Bain, G., Kitchens, D., Yao, M., Huettner, J. E. & Gottlieb, D. I. (1995) Dev. Biol. 168, 342–357. - PubMed

Publication types

Substances