. 2005 Oct;37(10):1055-62.
doi: 10.1038/ng1635. Epub 2005 Sep 4.

Sipa1 is a candidate for underlying the metastasis efficiency modifier locus Mtes1

Affiliations

Sipa1 is a candidate for underlying the metastasis efficiency modifier locus Mtes1

Yeong-Gwan Park et al. Nat Genet. 2005 Oct.

Abstract

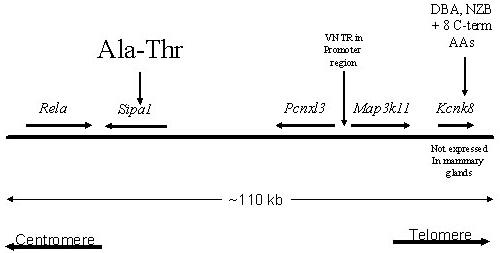
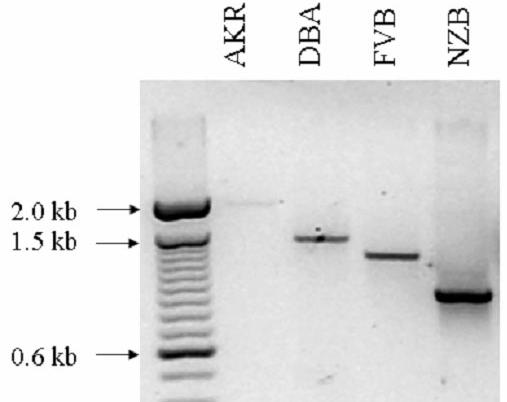
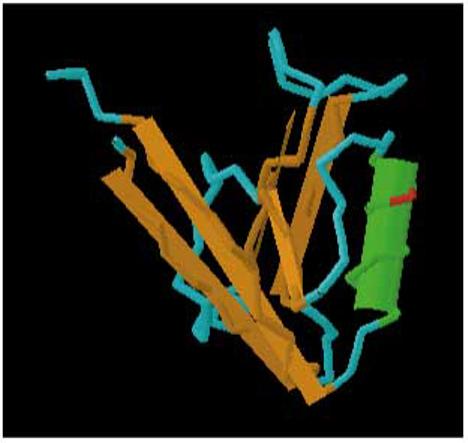
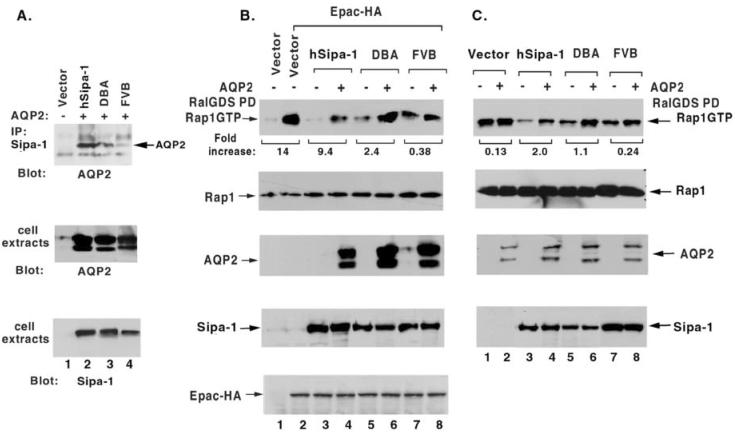
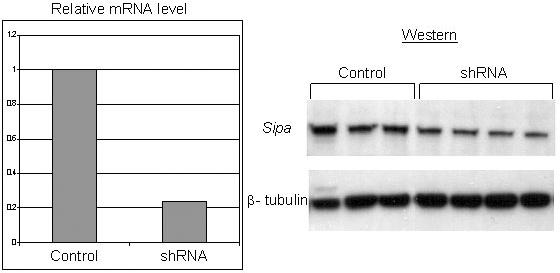
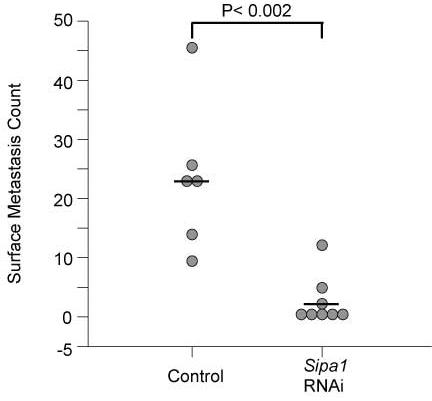
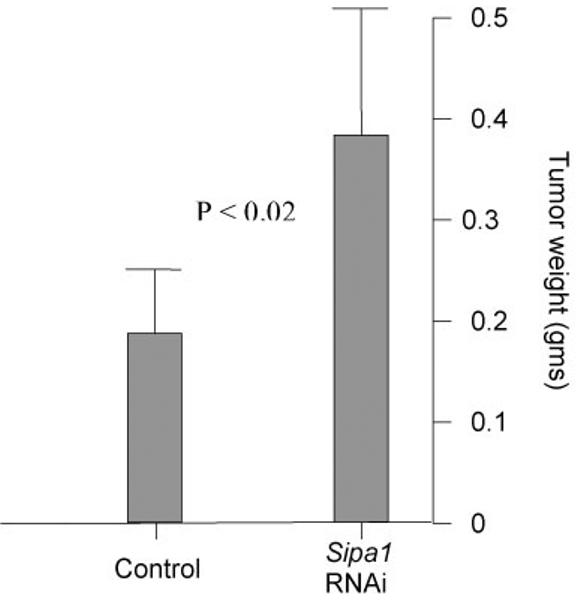
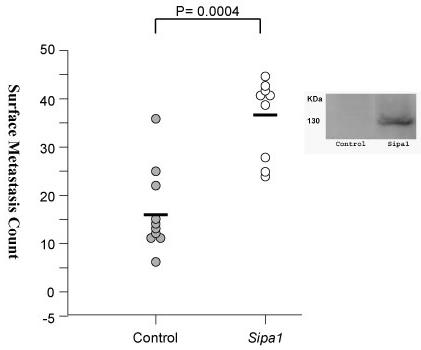
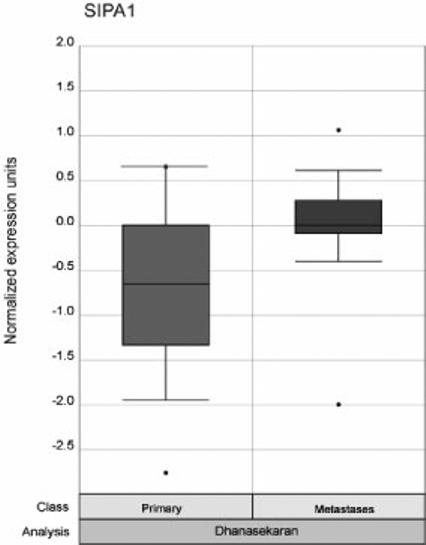
We previously identified loci in the mouse genome that substantially influence the metastatic efficiency of mammary tumors. Here, we present data supporting the idea that the signal transduction molecule, Sipa1, is a candidate for underlying the metastasis efficiency modifier locus Mtes1. Analysis of candidate genes identified a nonsynonymous amino acid polymorphism in Sipa1 that affects the Sipa1 Rap-GAP function. Spontaneous metastasis assays using cells ectopically expressing Sipa1 or cells with knocked-down Sipa1 expression showed that metastatic capacity was correlated with cellular Sipa1 levels. We examined human expression data and found that they were consistent with the idea that Sipa1 concentration has a role in metastasis. Taken together, these data suggest that the Sipa1 polymorphism is one of the genetic polymorphisms underlying the Mtes1 locus. This report is also the first demonstration, to our knowledge, of a constitutional genetic polymorphism affecting tumor metastasis.


Figures

Figure 1
Figure 1
A) Schematic representation of the Mtes1/Sipa1 candidate haplotype interval. The chromosome is represented by the solid horizontal bar, with the centromere to the left and telomere to the right. The genes and their orientation are indicated by the arrow above the bar. Potentially significant polymorphisms are depicted above the genes. B) Size of the Map3k11 VNTR in four strains of mice as determined by PCR amplification. Size of the VNTR does not correlate with metastatic potential since the low metastatic strain, DBA/2J, is intermediate between the two highly metastatic strains, AKR/J and FVB/NJ. C) Three dimensional modeling of the PDZ domain to identify the location of the polymorphism. The A739T polymorphism is represented by the red section of the wire diagram on the open face of the alpha-helical region.
Figure 1
Figure 1
A) Schematic representation of the Mtes1/Sipa1 candidate haplotype interval. The chromosome is represented by the solid horizontal bar, with the centromere to the left and telomere to the right. The genes and their orientation are indicated by the arrow above the bar. Potentially significant polymorphisms are depicted above the genes. B) Size of the Map3k11 VNTR in four strains of mice as determined by PCR amplification. Size of the VNTR does not correlate with metastatic potential since the low metastatic strain, DBA/2J, is intermediate between the two highly metastatic strains, AKR/J and FVB/NJ. C) Three dimensional modeling of the PDZ domain to identify the location of the polymorphism. The A739T polymorphism is represented by the red section of the wire diagram on the open face of the alpha-helical region.
Figure 2
Figure 2
The A739T polymorphism affects complex formation with AQP2 and the RapGAP function of Sipa1in an AQP2-dependent manner. A). Co-immunoprecipitation of AQP2 with Sipa1. AQP2 was transiently co-expressed with Human Sipa1 or mouse Sipa1 from DBA or FVB in COS7 cells. In the upper panel, anti-Sipa1 immunocomplexes were immunoblotted with anti-AQP2 antibodies. The middle and lower panels show, respectively, the expression of AQP2 and Sipa1 or Sipa1 in cell extracts. B) and C). Influence of AQP2 on the RapGAP activity of Sipa1. B: COS7 cells. C: U373MG cells. Both lines have very low levels of endogenous Sipa1 and AQP2. Human SIPA1 or mouse Sipa1 from DBA or FVB was expressed transiently in COS 7 cells (B) or as stable clones in U373MG (C). EPAC-HA, a Rap-specific guanine nucleotide exchange factor, was added transiently to the COS7 cells, to raise their level of GTP•Rap1. AQP2 was also transiently expressed in the COS7 and U373MG cells. A preliminary experiment (not shown) indicated that transfection of AQP2 alone into parental COS7 cells did not alter the endogenous level of GTP•Rap1. The upper panel of B and C shows the in vivo level of GTP•Rap1, which was assayed by RalGDS pull-down, as an indicator of the relative Rap GAP activity in the presence or absence of AQP2. The relative signal densities of GTP•Rap1 were quantified by Scion Image. The numbers under the upper panel refer to the “fold increase” in GTP•Rap1 for a particular Sipa1 allele when the GTP•Rap1 level with AQP2 was compared to the level without AQP2. The “fold increase” is 1 less than the fold difference. Thus, a 2-fold difference is designated a 1-fold increase. The remaining panels in B and C are immunoblots of cell extracts that document the relative level of the indicated protein. The Rap1 immunoblots also serve as loading controls.
Figure 3
Figure 3
shRNA knockdown of Sipa1. The relative abundance of Sipa1 mRNA in the empty vector control cell line and the shRNA cell line is shown in the left panel. The right panel shows western blot analysis demonstrating the reduction of Sipa1 protein levels in the shRNA cells compared to the control cell line with β-tubulin as a loading control.
Figure 4
Figure 4
A) Scatterplot of the results of the shRNA experimental metastasis assay. The empty vector cell line is displayed on the left side of the graph, the cell line expressing the shRNA Sipa1 construct is shown on the right. B) Graphical representation of the tumor weights of the control and shRNA cell lines in the experimental metastasis assay. Standard deviation is shown by the error bars. P value for the difference between the two groups is also displayed.
Figure 4
Figure 4
A) Scatterplot of the results of the shRNA experimental metastasis assay. The empty vector cell line is displayed on the left side of the graph, the cell line expressing the shRNA Sipa1 construct is shown on the right. B) Graphical representation of the tumor weights of the control and shRNA cell lines in the experimental metastasis assay. Standard deviation is shown by the error bars. P value for the difference between the two groups is also displayed.
Figure 5
Figure 5
Photomicrographs of the grow properties and morphology of the empty vector (A, C) versus the shRNA (B, D) cell lines. The Mvt1 cell line produces many rounded cells when grown to confluence compared to the flat sheet observed in the RNAi knockdown cell line. The RNAi knockdown cell line also displays a more spindle shaped morphology than the more metastatic empty vector control.
Figure 6
Figure 6
Scatterplot of the lung surface metastasis counts of mice implanted with the Sipa1 ectopically overexpressing cell line. The empty vector cell line is displayed on the left side of the graph, the cell line overexpressing the epitope tagged Sipa1 construct is shown on the right side of the graph. To the right of the graph is a western blot showing expression of the V5-His6 epitope tagged Sipa1 protein.
Figure 7
Figure 7
Graphical results of the Oncomine meta-analysis. The Oncomine website was analyzed for whether Sipa1 was significantly differentially expressed in metastatic versus non-metastatic tumors. Expression in the non-metastatic tumors is displayed as the box plot on the left of the figure and the metastatic tumors on the right. The p value for the meta-analysis is displayed at the top of the figure.

Comment in

References

    1. Liotta LA, Stetler-Stevenson WG. Principles of molecular cell biology of cancer: Cancer metastasis. J.B. Lippincott Co.; Philadelphia, PA: 1993. pp. 134–149.
    1. Fisher B. From Halsted to prevention and beyond: advances in the management of breast cancer during the twentieth century. Eur J Cancer. 1999;35:1963–73. - PubMed
    1. Schmidt-Kittler O, et al. From latent disseminated cells to overt metastasis: genetic analysis of systemic breast cancer progression. Proc Natl Acad Sci U S A. 2003;100:7737–42. - PMC - PubMed
    1. Heimann R, Lan F, McBride R, Hellman S. Separating favorable from unfavorable prognostic markers in breast cancer: the role of E-cadherin. Cancer Res. 2000;60:298–304. - PubMed
    1. Guy CT, Cardiff RD, Muller WJ. Induction of mammary tumors by expression of polyomavirus middle T oncogene: A transgenic mouse model for metastatic disease. MCB. 1992;12:954–961. - PMC - PubMed

Publication types