. 2006 Apr;27(4):325-39.
doi: 10.1002/hbm.20188.

Reading embossed capital letters: an fMRI study in blind and sighted individuals

Affiliations

Reading embossed capital letters: an fMRI study in blind and sighted individuals

H Burton et al. Hum Brain Mapp. 2006 Apr.

Abstract

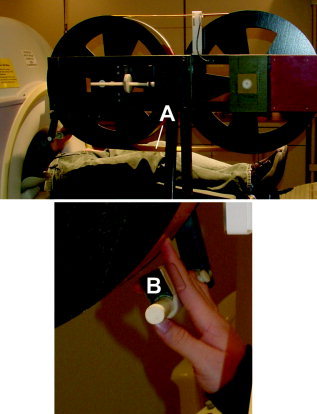
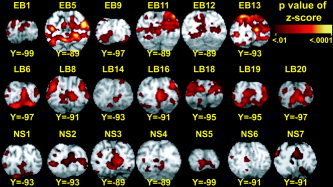
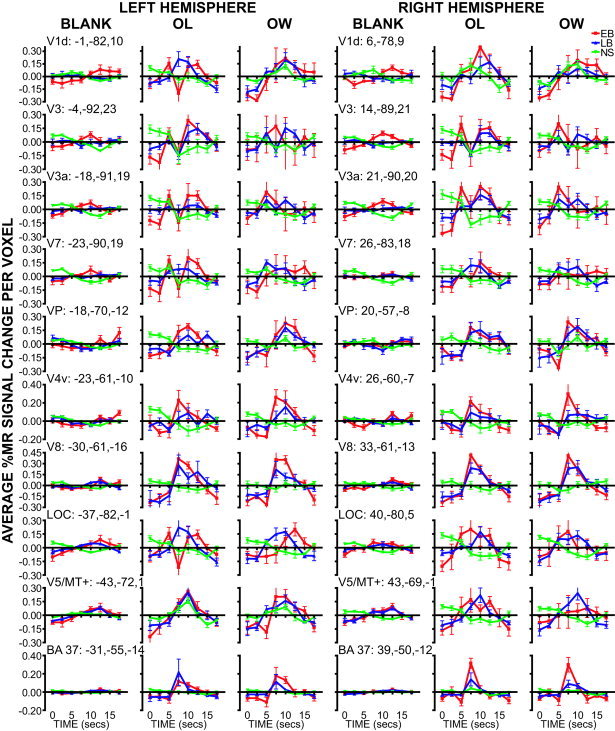
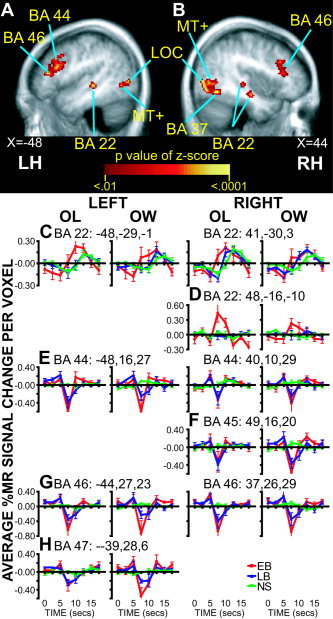
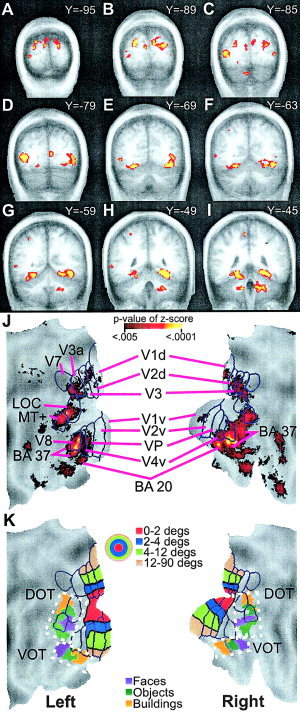
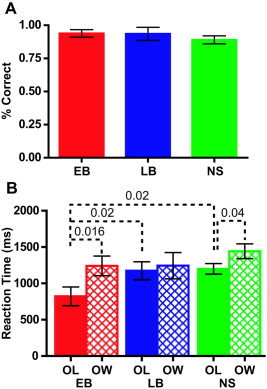
Reading Braille activates visual cortex in blind people [Burton et al., J Neurophysiol 2002;87:589-611; Sadato et al., Nature 1996;380:526-528; Sadato et al., Brain 1998;121:1213-1229]. Because learning Braille requires extensive training, we had sighted and blind people read raised block capital letters to determine whether all groups engage visual cortex similarly when reading by touch. Letters were passively rubbed across the right index finger at 30 mm/s using an MR-compatible drum stimulator. Age-matched sighted, early blind (lost sight 0-5 years), and late blind (lost sight >5.5 years) volunteers performed three tasks: stating an identified letter, stating a verb containing an identified letter, and feeling a moving smooth surface. Responses were voiced immediately after the drum stopped moving across the fingertip. All groups showed increased activity in visual areas V1 and V2 during both letter identification tasks. Blind compared to sighted participants showed greater activation increases predominantly in the parafoveal-peripheral portions of visuotopic areas and posterior parts of BA 20 and 37. Sighted participants showed suppressed activity in most of the same areas except for small positive responses bilaterally in V1, left V5/MT+, and bilaterally in BA 37/20. Blind individuals showed suppression of the language areas in the frontal cortex, while sighted individuals showed slight positive responses. Early blind showed a more extensive distribution of activity in superior temporal sulcal multisensory areas. These results show cross-modal reorganization of visual cortex and altered response dynamics in nonvisual areas that plausibly reflect mechanisms for adaptive plasticity in blindness.

Reading Braille activates visual cortex in blind people [Burton et al., J Neurophysiol 2002;87:589–611; Sadato et al., Nature 1996;380:526–528; Sadato et al., Brain 1998;121:1213–1229]. Because learning Braille requires extensive training, we had sighted and blind people read raised block capital letters to determine whether all groups engage visual cortex similarly when reading by touch. Letters were passively rubbed across the right index finger at 30 mm/s using an MR‐compatible drum stimulator. Age‐matched sighted, early blind (lost sight 0–5 years), and late blind (lost sight >5.5 years) volunteers performed three tasks: stating an identified letter, stating a verb containing an identified letter, and feeling a moving smooth surface. Responses were voiced immediately after the drum stopped moving across the fingertip. All groups showed increased activity in visual areas V1 and V2 during both letter identification tasks. Blind compared to sighted participants showed greater activation increases predominantly in the parafoveal‐peripheral portions of visuotopic areas and posterior parts of BA 20 and 37. Sighted participants showed suppressed activity in most of the same areas except for small positive responses bilaterally in V1, left V5/MT+, and bilaterally in BA 37/20. Blind individuals showed suppression of the language areas in the frontal cortex, while sighted individuals showed slight positive responses. Early blind showed a more extensive distribution of activity in superior temporal sulcal multisensory areas. These results show cross‐modal reorganization of visual cortex and altered response dynamics in nonvisual areas that plausibly reflect mechanisms for adaptive plasticity in blindness. Hum Brain Mapp, 2005. © 2005 Wiley‐Liss, Inc.


Figures

Figure 1
Figure 1
The rotating drum device used to passively translate embossed capital letters against the right index fingertip from proximal to distal. The device was constructed using two fiberglass wheels and a connecting belt (A) that consists of a flexible photopolymer printing material embossed with five tracks of block capital letters using a commercial photo etching process (B.W. Johnson, Joplin, MO). An adjustable finger/hand rest (B) aligned the fingertip over a selected track for each imaging run.
Figure 3
Figure 3
Distribution of increased activity is shown for a posterior occipital portion of V1. Results are shown from individuals with suprathreshold responses. Images are multiple‐comparison corrected cross‐correlation z‐score maps (minimum z = 4, two face‐connected voxels) overlaid onto atlas transformed [Talairach and Tournoux, 1988] structural anatomy for each individual. Labels cross‐reference to demographic characteristics listed in Table I (early blind, EB; late blind, LB; and sighted, NS).
Figure 5
Figure 5
Time course plots for occipito‐temporal ROIs identified from the ANOVA time‐by‐group factor. Data at each time point shows group mean and SEM (early blind, EB; late blind, LB; and sighted, NS). Each column shows data obtained during a different task (BLANK, passive stimulation with a moving smooth surface; OL, stating the identified letter, OW, stating a verb that contains the identified letter). Atlas coordinate locations are listed for peak, based on a center‐of‐mass calculation, z‐score of the ANOVA time‐by‐group factor. Abbreviations: see Figure 4.
Figure 6
Figure 6
ROIs in the temporal and frontal cortex. A,B: Selected sagittal sections of the ANOVA time‐by‐group factor. C,D: Time course plots for regions in temporal cortex BA 22. E–H: Time course plots for frontal cortex regions in BA 44–47. Data at each time point shows group mean and SEM (early blind, EB; late blind, LB; and sighted, NS). Each column shows data obtained during a different task (OL, overt letter identification, OW, overt word whose spelling includes identified letter). Atlas coordinate locations are listed for peak, based on a center‐of‐mass calculation for the ANOVA time‐by‐group factor z‐score. Abbreviations: see Figure 4.
Figure 4
Figure 4
Distribution of multiple comparison corrected z‐scores of significant F‐ratios for the ANOVA time‐by‐group factor are shown on selected coronal sections (A–I) and surface‐based reconstruction of the occipito‐temporal cortex (J). Scale for P‐values of z‐scores shows range for images illustrated in A–J. Surface anatomy created using a population‐average landmark‐linked and surface‐based atlas [PALS; Van Essen, 2005]. J: Projection of borders onto PALS and labeling of visual areas are from prior identifications in sighted people [Hadjikhani et al., 1998; Van Essen, 2004]. K: Projection of eccentricity bands for lower tier visual areas onto PALS. Color scale in concentric circles shows different degrees of eccentricity. Foveal to peripheral eccentricity bands in the surface‐based reconstruction align from the bottom to the top in dorsal visual areas and from the top to the bottom in ventral visual areas. In the volume images (A–I), foveal to peripheral ordering of eccentricity bands occupies, respectively, posterior to anterior Talairach atlas coordinates. In addition, object selective regions in ventral and dorsal occipito‐temporal cortex (VOT and DOT) were projected onto PALS using spheres centered on previously reported centers‐of‐mass coordinates [Hasson et al., 2002]. The color scale shown by boxes indicates regions activated when viewing different objects. Hasson et al. proposed for sighted people a hypothetical scheme for foveal/central gaze, parafoveal, and peripheral eccentricity bands related, respectively, to face, object, and scene activated regions [Hasson et al., 2002]. Brodmann area, BA; dorsal and ventral occipito‐temporal cortex, DOT and VOT; lateral occipital complex, LOC; medial temporal area, MT; dorsal and ventral primary visual areas, V1d, V1v; dorsal and ventral second visual areas, V2d, V2v; third visual areas, V3, V3a; ventral fourth visual area, V4v; ventral posterior visual area, VP; seventh visual area, V7; eighth visual area, V8.
Figure 2
Figure 2
Accuracy and reaction times for early (EB), late (LB) blind, and sighted (NS) people were obtained during fMRI. A: Proportion of letters correctly identified during the overt letter task (mean and SEM). B: Reaction times (mean and SEM) to all responses were measured from the peak of the voiced response to the end of rotation of each letter string in overt letter (OL) and word (OW) tasks. Dashed lines labeled with P‐values connect significant Mann‐Whitney U‐test or Wilcoxon matched pairs test.

Similar articles

Cited by

References

    1. Aleman A, van Lee L, Mantione MH, Verkoijen IG, de Haan EH (2001): Visual imagery without visual experience: evidence from congenitally totally blind people. Neuroreport 12: 2601–2604. - PubMed
    1. Amedi A, Raz N, Pianka P, Malach R, Zohary E (2003): Early 'visual' cortex activation correlates with superior verbal memory performance in the blind. Nat Neurosci 6: 758–766. - PubMed
    1. Andersson JL, Sundin A, Valind S (1995): A method for coregistration of PET and MR brain images. J Nucl Med 36: 1307–1315. - PubMed
    1. Arno P, De Volder AG, Vanlierde A, Wanet‐Defalque MC, Streel E, Robert A, Sanabria‐Bohorquez S, Veraart C (2001): Occipital activation by pattern recognition in the early blind using auditory substitution for vision. Neuroimage 13: 632–645. - PubMed
    1. Beauchamp MS, Argall BD, Bodurka J, Duyn JH, Martin A (2004a): Unraveling multisensory integration: patchy organization within human STS multisensory cortex. Nat Neurosci 7: 1190–1192. - PubMed

MeSH terms