

Retardation of cell growth by avian reovirus p17 through the activation of p53 pathway
- PMID: 16143310
- PMCID: PMC7092890
- DOI: 10.1016/j.bbrc.2005.08.149
Retardation of cell growth by avian reovirus p17 through the activation of p53 pathway
Abstract
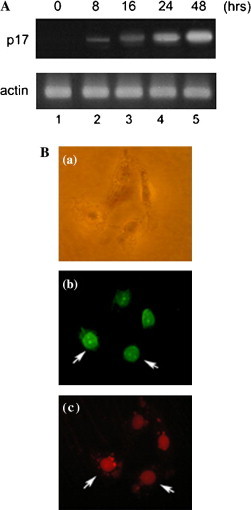
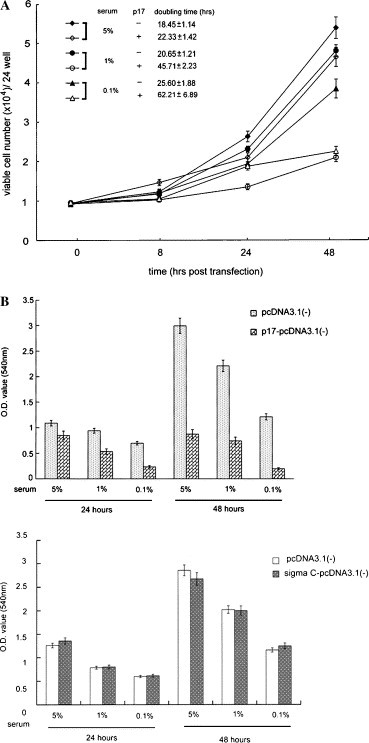
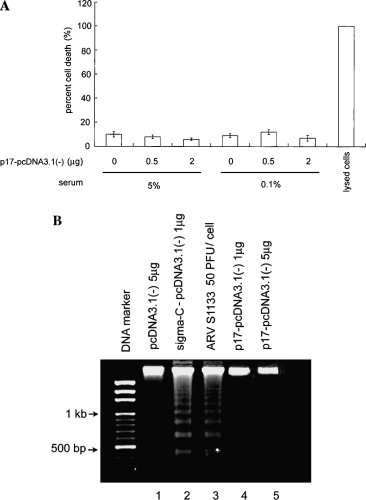
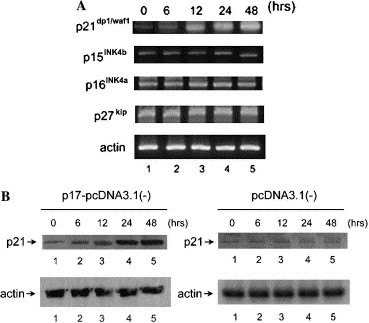
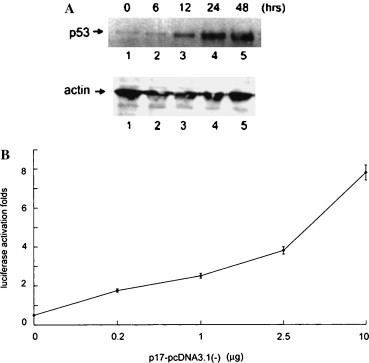
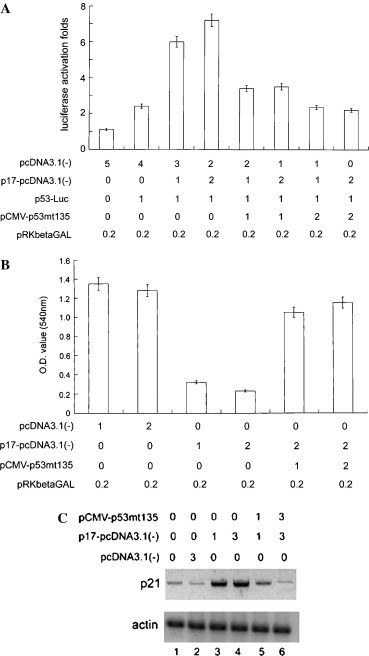
The second open reading frame of avian reovirus S1 gene segment encodes a 17 kDa non-structural protein, named p17. The biological role of p17 is fully unknown so far. Using trypan blue dye exclusion and MTT assay, we demonstrated that the ectopic expression of p17 results in the reduction of viable cell number and cell proliferation rate of Vero, BHK, 293, and HeLa cells. Measurement of LDH activity and DNA fragmentation analysis revealed that p17 expression did not cause cell death or apoptosis. These data indicated that the p17 possessed the growth retardation function. Semi-quantitative RT-PCR and Western blotting revealed that p17-expressing cells induced the expression of CDK inhibitor p21cip1/waf1 in a time- and dose-dependent manner, but the transcripts of CDK inhibitor p15INK4b, p16INK4a, or p27kip were not altered. In the presence of p17, the p53 protein level and p53-driven reporter activity were elevated significantly. Dominant negative p53 alleviated the p21 accumulation, p53 activation, and growth inhibition effect induced by p17. Taken together, these studies revealed a possible intrinsic function of p17 in growth regulation through the activation of p53 and p21cip1/waf1.
Figures
Similar articles
-
Suppression of Vimentin Phosphorylation by the Avian Reovirus p17 through Inhibition of CDK1 and Plk1 Impacting the G2/M Phase of the Cell Cycle.PLoS One. 2016 Sep 7;11(9):e0162356. doi: 10.1371/journal.pone.0162356. eCollection 2016. PLoS One. 2016. PMID: 27603133 Free PMC article.
-
Avian Reovirus Protein p17 Functions as a Nucleoporin Tpr Suppressor Leading to Activation of p53, p21 and PTEN and Inactivation of PI3K/AKT/mTOR and ERK Signaling Pathways.PLoS One. 2015 Aug 5;10(8):e0133699. doi: 10.1371/journal.pone.0133699. eCollection 2015. PLoS One. 2015. PMID: 26244501 Free PMC article.
-
Avian reovirus nonstructural protein p17-induced G(2)/M cell cycle arrest and host cellular protein translation shutoff involve activation of p53-dependent pathways.J Virol. 2010 Aug;84(15):7683-94. doi: 10.1128/JVI.02604-09. Epub 2010 May 19. J Virol. 2010. Retraction in: J Virol. 2014 Feb;88(3):1856. doi: 10.1128/JVI.03512-13. PMID: 20484520 Free PMC article. Retracted.
-
Multiple pathways control cell growth and transformation: overlapping and independent activities of p53 and p21Cip1/WAF1/Sdi1.J Pathol. 1997 Oct;183(2):134-40. doi: 10.1002/(SICI)1096-9896(199710)183:2<134::AID-PATH960>3.0.CO;2-D. J Pathol. 1997. PMID: 9390024 Review.
-
Early steps in avian reovirus morphogenesis.Curr Top Microbiol Immunol. 2006;309:67-85. doi: 10.1007/3-540-30773-7_3. Curr Top Microbiol Immunol. 2006. PMID: 16909897 Review.
Cited by
-
Molecular characterization of avian reovirus isolates in Tunisia.Virol J. 2013 Jan 5;10:12. doi: 10.1186/1743-422X-10-12. Virol J. 2013. PMID: 23289825 Free PMC article.
-
The p17 nonstructural protein of avian reovirus triggers autophagy enhancing virus replication via activation of phosphatase and tensin deleted on chromosome 10 (PTEN) and AMP-activated protein kinase (AMPK), as well as dsRNA-dependent protein kinase (PKR)/eIF2α signaling pathways.J Biol Chem. 2013 Feb 1;288(5):3571-84. doi: 10.1074/jbc.M112.390245. Epub 2012 Dec 11. J Biol Chem. 2013. PMID: 23233667 Free PMC article.
-
Heterogeneous Nuclear Ribonucleoprotein A1 and Lamin A/C Modulate Nucleocytoplasmic Shuttling of Avian Reovirus p17.J Virol. 2019 Sep 30;93(20):e00851-19. doi: 10.1128/JVI.00851-19. Print 2019 Oct 15. J Virol. 2019. PMID: 31375578 Free PMC article.
-
PQBP1 regulates the cellular inflammation induced by avian reovirus and interacts with the viral p17 protein.Virus Res. 2023 Jul 15;332:199119. doi: 10.1016/j.virusres.2023.199119. Epub 2023 May 26. Virus Res. 2023. PMID: 37201645 Free PMC article.
-
Isolation, Identification, and Pathogenicity of an Avian Reovirus Epidemic Strain in Xinjiang, China.Viruses. 2025 Mar 30;17(4):499. doi: 10.3390/v17040499. Viruses. 2025. PMID: 40284942 Free PMC article.
References
-
- Bodelon G., Labrada L., Martinez-Costas J., Benavente J. The avian reovirus genome segment S1 is functionally tricistronic gene that express one structural and two nonstructural proteins in infected cells. Virology. 2001;290:181–191. - PubMed
-
- Brown J.P., Pagano M. Mechanisms of p53 degradation. Biochim. Biophys. Acta. 1997;1332:1–6. - PubMed
-
- airns P., Mao L., Merlo A., Lee D.J., Schwabb D., Eby Y., Tokino K., Vanderletf P., Blaugrund J.E., Sidransky D. Rates of p16 (MTS1) mutations in primary tumors with 9p loss. Science. 1994;265:415–416. - PubMed
-
- Carmichael J., DeGraff W.G., Gazdar A.F., Minna J.D., Mitchell J.B. Evaluation of a tetrazolium-based semiautomated colorimetric assay: assessment of chemosensitivity testing. Cancer Res. 1987;47:936–942. - PubMed
Publication types
MeSH terms
Substances
LinkOut - more resources
Full Text Sources
Research Materials
Miscellaneous
