Comparative Study
. 2005 Sep 12;170(6):935-45.
doi: 10.1083/jcb.200505166. Epub 2005 Sep 6.

LIS1 RNA interference blocks neural stem cell division, morphogenesis, and motility at multiple stages

Affiliations
Comparative Study

LIS1 RNA interference blocks neural stem cell division, morphogenesis, and motility at multiple stages

Jin-Wu Tsai et al. J Cell Biol. .

Abstract

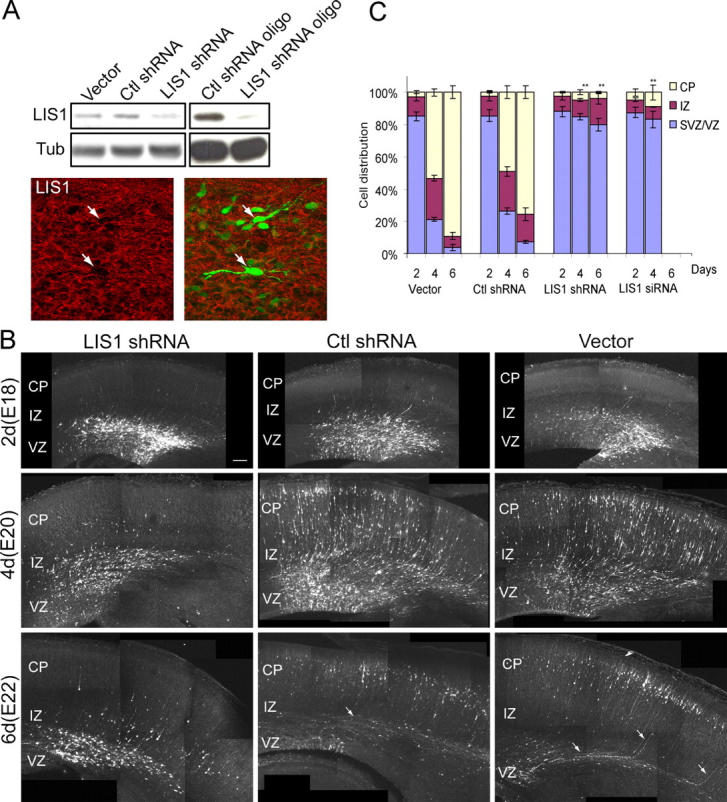
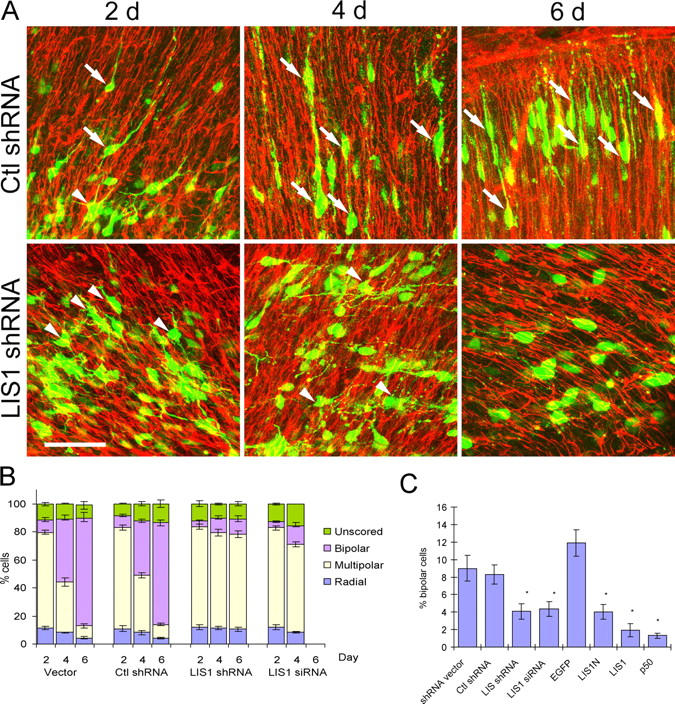
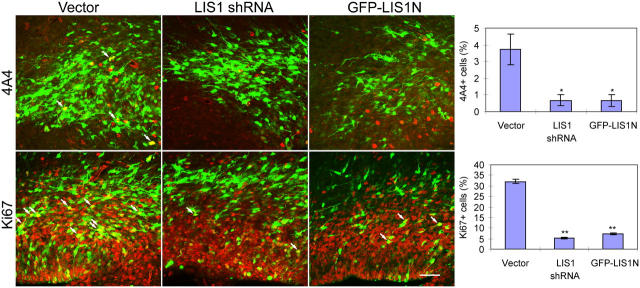
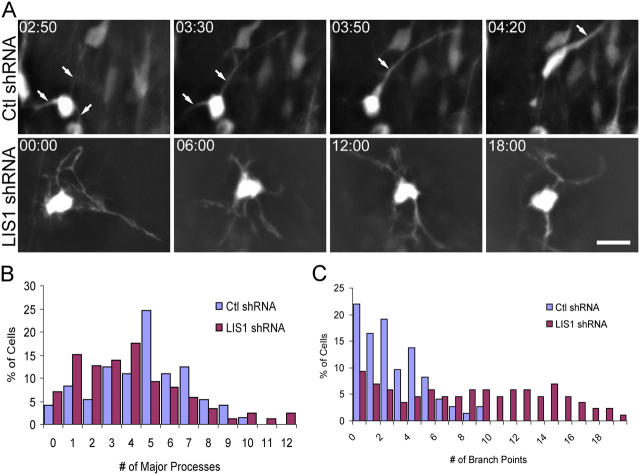
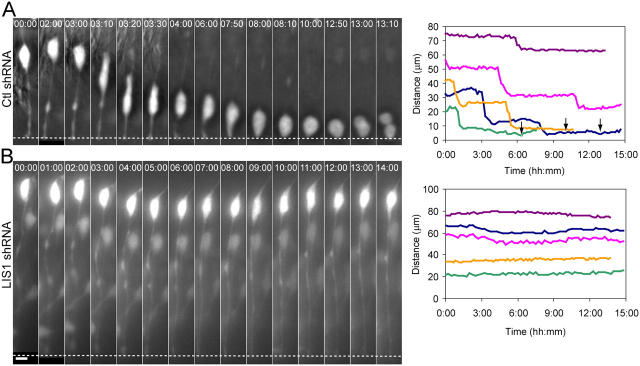
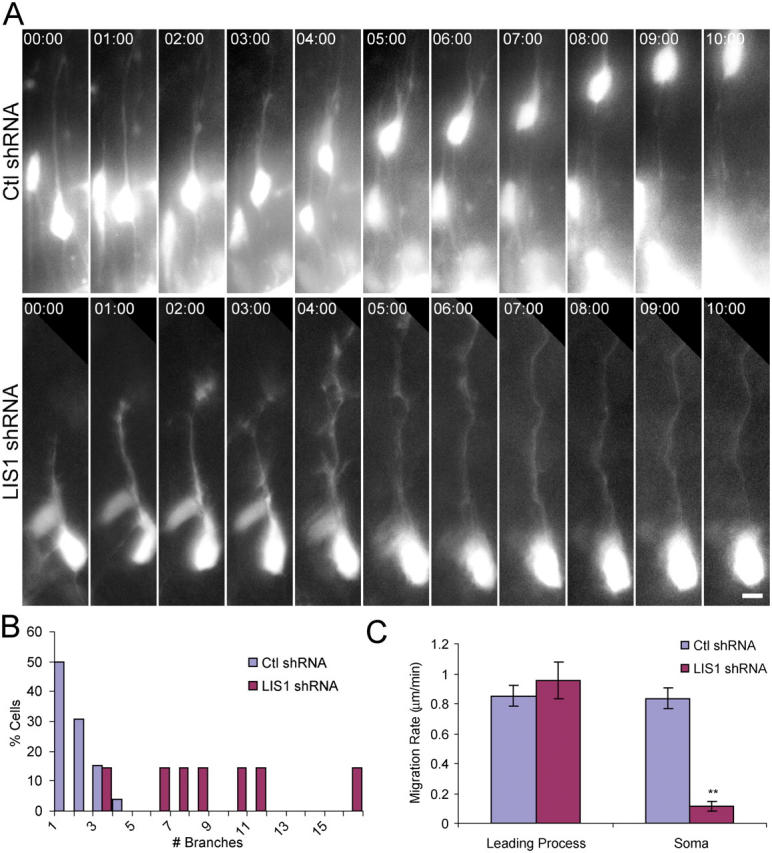
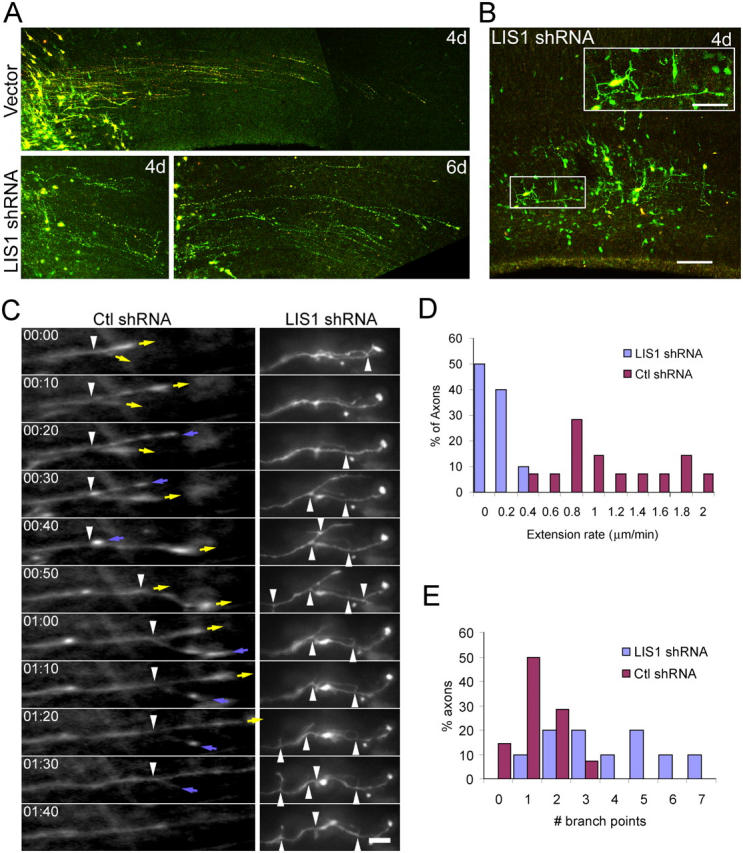
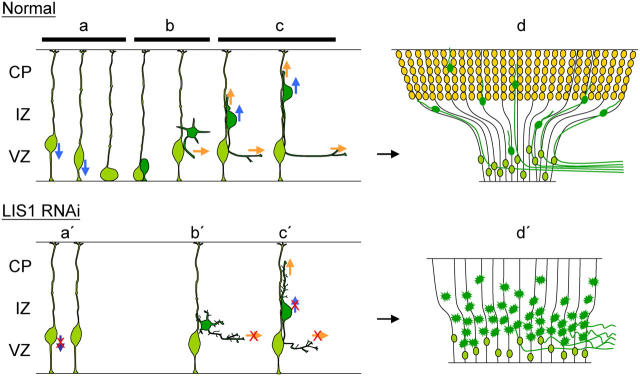
Mutations in the human LIS1 gene cause the smooth brain disease classical lissencephaly. To understand the underlying mechanisms, we conducted in situ live cell imaging analysis of LIS1 function throughout the entire radial migration pathway. In utero electroporation of LIS1 small interference RNA and short hairpin dominant negative LIS1 and dynactin cDNAs caused a dramatic accumulation of multipolar progenitor cells within the subventricular zone of embryonic rat brains. This effect resulted from a complete failure in progression from the multipolar to the migratory bipolar state, as revealed by time-lapse analysis of brain slices. Surprisingly, interkinetic nuclear oscillations in the radial glial progenitors were also abolished, as were cell divisions at the ventricular surface. Those few bipolar cells that reached the intermediate zone also exhibited a complete block in somal translocation, although, remarkably, process extension persisted. Finally, axonal growth also ceased. These results identify multiple distinct and novel roles for LIS1 in nucleokinesis and process dynamics and suggest that nuclear position controls neural progenitor cell division.


Figures

Figure 1.
Figure 1.
Effect of RNAi on LIS1 expression and neural progenitor cell distribution. (A, top) Western blot of LIS1 and tubulin in COS7 cells 48 h after transfection with LIS1 shRNA vectors or oligonucleotides. LIS1 levels in cells transfected with LIS1 shRNA or oligonucleotides were much lower than those in cells transfected with triple point mutated shRNA, empty vector, or control oligonucleotide. (Bottom) Immunostaining of LIS1 (red) in E18 rat neocortical neural progenitor cells transfected in utero at E16 with LIS1 shRNA vector, which also expresses GFP marker (green). Note the loss of LIS1 in GFP-expressing cells (arrows). (B) Disruption of cell redistribution in the neocortex by LIS1 RNAi. Coronal sections of rat brain 2, 4, and 6 d after electroporation at E16 with LIS1 shRNA, control shRNA, or empty vector. Cells expressing LIS1 shRNA were largely restricted to the VZ/SVZ, although some appeared within the lower IZ by days 4 and 6 (left). In contrast, cells transfected with control shRNA or empty vector migrated radially from the VZ to the CP with increasing time (middle and right). Note the additional lateral spread of VZ/SVZ cells in the control. Arrows, axonlike processes extending from migratory bipolar cells (see Altered Axonal Extension). Bar, 100 μm. (C) Percentages of cells transfected with empty, control shRNA, LIS1 shRNA vectors, and LIS1 siRNA oligonucleotide in different regions of the neocortex. The signal of Cy3-siRNA–transfected cells at day 6 was too low to detect. Error bars represent SEM. t test: *, P < 0.05; **, P < 0.01.
Figure 2.
Figure 2.
Morphology of LIS1 shRNA–transfected cells. (A) Morphology of cells transfected with control (top) and LIS1 shRNA (bottom) vectors (green) 2, 4, and 6 d after electroporation at E16 and counterstained with antinestin antibody (red). Many control cells migrated to the IZ and CP, where they became bipolar (arrows), whereas most LIS1 shRNA–transfected cells remained in the SVZ with a multipolar morphology (arrowheads). Bar, 50 μm. (B) Quantitative effects of LIS1 RNAi on cell morphology. In control brains, GFP-expressing radial glial and multipolar cells were maximal at posttransfection day 2 and decreased with time, and the number of bipolar cells increased. In LIS1 shRNA– and siRNA-transfected brains, the numbers of radial glial and multipolar cells remained relatively constant with time. (C) Comparison of bipolar cell number under diverse inhibitory conditions 2 d after electroporation. All dominant negative and siRNA constructs markedly decreased the ratio of bipolar to total transfected cells. Error bars represent SEM. t test: *, P < 0.05.
Figure 3.
Figure 3.
Cell cycle stage of transfected cells. Brains were transfected with empty vector, LIS1 shRNA, or GFP-LIS1N (green) at E16 and, 2 d later, were immunostained with antibodies to the M-phase marker phosphovimentin (4A4, red; top), and Ki67 (red; bottom), which is a transcription factor expressed from S through M phase. Transfected cells positive for either marker appear yellow (arrows). Bar, 50 μm. The percentage of total transfected cells that were positive for 4A4 or Ki67 was reduced significantly in LIS1 shRNA– and GFP-LIS1N–transfected brains relative to controls. Error bars represent SEM. t test: *, P < 0.05; **, P < 0.01.
Figure 4.
Figure 4.
Live cell imaging of the conversion of neural progenitor cells from multipolar to bipolar morphology. (A) Slices from rat brain electroporated in utero with control or LIS1 shRNA vector at E16 were placed into culture at E18 and imaged every 10 min by GFP fluorescence microscopy. Multiple processes of the control neuron at the top (arrows) give way to a single major process at the top as the cell initiates radial migration (Videos 1 and 2, available at http://www.jcb.org/cgi/content/full/jcb.200505166/DC1). Cell expressing shRNA for LIS1 (bottom) persisted in the multipolar state for 18 h of observation (Video 3). Time is shown in hours/minutes. Bar, 10 μm. (B) Number of primary processes emanating from a multipolar cell body varied over a broad but similar range in control versus LIS1 shRNA–transfected cells. (C) Number of process branch points per cell were increased in LIS1 siRNA–transfected cells versus controls.
Figure 5.
Figure 5.
Live cell imaging of neural progenitor cell behavior within the VZ. (A) Cell body of a control progenitor cell at the radial glial stage migrates away from and then toward the ventricular surface (dotted lines), where it divides by the last time point (Video 5, available at http://www.jcb.org/cgi/content/full/jcb.200505166/DC1). Tracings of cell body positions for five typical controls show rapid but discontinuous movements. Arrows indicate the time of cell division. (B) Cell body of a LIS1 shRNA–transfected cell is relatively immobile over a 14-h time period (Video 6). Tracings show that the cell body position is relatively constant and that stepwise changes are not observed. Note that the behavior of cell bodies in control and experimental cases are independent of starting position relative to the ventricular surface. Times are shown in hours/minutes. Bar, 5 μm.
Figure 6.
Figure 6.
Live cell imaging of neural progenitor cell behavior within the IZ. Rat brains were electroporated with LIS1 (bottom) or control shRNA (top) constructs at E16, and the brains were sectioned and cultured 3 d later. (A) Images from bipolar cells within the IZ. Control cells extended a leading process toward the CP, and the cell body followed, resulting in forward locomotion with a process of relatively constant length (Video 7, available at http://www.jcb.org/cgi/content/full/jcb.200505166/DC1). When transfected with LIS1 shRNA, the leading process of the cells continued to grow, but the cell body remained immobile. The leading process also extended many short projections along its length (Video 8). Time is shown in hours/minutes. Bar, 5 μm. (B) Branching of leading process in the IZ. Control cells normally had one to three branches, whereas there were many small branches in LIS1 shRNA–transfected cells. (C) Rate of leading process extension and somal migration. The rate of process extension was almost unchanged by LIS1 RNAi, but somal movement was largely abolished. Error bars represent SEM. t test: **, P < 0.01.
Figure 7.
Figure 7.
Live cell imaging of axonlike processes. Rat brain was electroporated with control or LIS1 RNAi construct at E16. (A) Fixed images of axonlike processes in control (vector) cells 4 d posttransfection (top). These processes extend tangentially toward the medial line from most postmitotic neurons in the SVZ and IZ. In LIS1 shRNA–transfected brains, axonlike processes were observed in the same orientation, although they were shorter, more curved, and more branched (bottom panels show days 4 and 6 posttransfection). (B) Most of the axonlike processes in LIS1 shRNA–transfected cells could be seen to originate from multipolar cells. Bar, 100 μm. Box shows the magnification of a multipolar cell extending an axonlike process. Bar, 20 μm. (C) Live cell imaging of axonal growth. Rat brain sections were placed into culture 2 d after electroporation, and images were recorded from the SVZ every 10 min. (Left) The control axons usually possessed only one branch point (arrowheads), with the two branches alternatively growing (yellow arrows) and retracting (blue arrows), resulting in an overall steady pattern of axonal elongation (0.7 μm/min in example shown; Video 9, available at http://www.jcb.org/cgi/content/full/jcb.200505166/DC1). (Right) Axons transfected with LIS1 shRNA construct exhibited multiple short branches (arrowheads indicate branch points), which extended and retracted dynamically. The overall length of the axon, however, stayed virtually constant (Video 10). Time is shown in hours/minutes. Bar, 10 μm. (D) Axonal growth rate. Axons of LIS1 shRNA–transfected cells grew much more slowly than controls. (E) Axonal branching was also substantially increased in LIS1 shRNA–transfected cells.
Figure 8.
Figure 8.
Schematic diagram showing the effects of LIS1 inhibition on neural progenitor cell proliferation, migration, and morphogenesis. (Top) Cortical neurons undergo distinct phases of neurogenesis and migration (Noctor et al., 2004). (a) The first step involves bidirectional interkinetic nuclear oscillations within radial glial cells (light green). Cell division occurs at the ventricular surface. (b) Postmitotic neurons (dark green) then migrate away from the ventricle and become paused in a multipolar state within the VZ/SVZ as they extend an axon. (c) Cells convert to a bipolar morphology and migrate along radial fibers to the CP as axonal growth continues. (d) As the orientation of radial fibers becomes distorted by cortical expansion, neuronal migration becomes increasingly outward directed. (Bottom) Neural progenitor cells exhibit as many as three discrete terminal effects of LIS1 RNAi. (a′) Radial glial cells cease interkinetic nuclear migration, and cell division is inhibited. (b′) Multipolar cells fail to transition to the bipolar migratory stage. (c′) Bipolar cells extend a leading process at normal rates, but the cell soma remains stationary. Although axons are extended from both multipolar and bipolar cells, the axons are more curved, branched, and grow more slowly. (d′) A preporderance of cells are arrested within the SVZ, resulting in subcortical band heterotopia, which is associated with classical lissencephaly. Both radial migration and lateral dispersion are disrupted, preventing neuronal cells from inserting into the CP and from contributing to further lateral spread. Blue and orange arrows indicate cell body movements and process extension, respectively. Red crosses indicate blocking of these activities.

Comment in

References

    1. Ahmad, F.J., J. Hughey, T. Wittmann, A. Hyman, M. Greaser, and P.W. Baas. 2000. Motor proteins regulate force interactions between microtubules and microfilaments in the axon. Nat. Cell Biol. 2:276–280. - PubMed
    1. Cahana, A., T. Escamez, R.S. Nowakowski, N.L. Hayes, M. Giacobini, A. von Holst, O. Shmueli, T. Sapir, S.K. McConnell, W. Wurst, et al. 2001. Targeted mutagenesis of Lis1 disrupts cortical development and LIS1 homodimerization. Proc. Natl. Acad. Sci. USA. 98:6429–6434. - PMC - PubMed
    1. Dobyns, W.B., and C.L. Truwit. 1995. Lissencephaly and other malformations of cortical development: 1995 update. Neuropediatrics. 26:132–147. - PubMed
    1. Dujardin, D.L., L.E. Barnhart, S.A. Stehman, E.R. Gomes, G.G. Gundersen, and R.B. Vallee. 2003. A role for cytoplasmic dynein and LIS1 in directed cell movement. J. Cell Biol. 163:1205–1211. - PMC - PubMed
    1. Echeverri, C.J., B.M. Paschal, K.T. Vaughan, and R.B. Vallee. 1996. Molecular characterization of the 50-kD subunit of dynactin reveals function for the complex in chromosome alignment and spindle organization during mitosis. J. Cell Biol. 132:617–633. - PMC - PubMed

Publication types

MeSH terms