Review
. 2005;15(7):853-66.
doi: 10.1002/hipo.20115.

Dual phase and rate coding in hippocampal place cells: theoretical significance and relationship to entorhinal grid cells

Affiliations
Review

Dual phase and rate coding in hippocampal place cells: theoretical significance and relationship to entorhinal grid cells

John O'Keefe et al. Hippocampus. 2005.

Abstract

We review the ideas and data behind the hypothesis that hippocampal pyramidal cells encode information by their phase of firing relative to the theta rhythm of the EEG. Particular focus is given to the further hypothesis that variations in firing rate can encode information independently from that encoded by firing phase. We discuss possible explanation of the phase-precession effect in terms of interference between two independent oscillatory influences on the pyramidal cell membrane potential, and the extent to which firing phase reflects internal dynamics or external (environmental) variables. Finally, we propose a model of the firing of the recently discovered "grid cells" in entorhinal cortex as part of a path-integration system, in combination with place cells and head-direction cells.


Figures

Figure 1
Figure 1
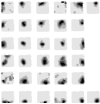
Firing rate maps for 35 place cells simultaneously recorded on multiple tetrodes (Recce and O’Keefe, 1989) in dorsal CA1. Each cell fires in well-localized portion of its environment. Firing rates (smoothed plots of number of spikes divided by time spent at each location) are shown in grey-scale plots with the darker shades signifying higher firing rates auto-scaled to the maximum for each cell. Adapted from (Lever et al., 2002).
Figure 2
Figure 2
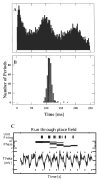
Many hippocampal pyramidal cells fire a series of bursts as the animal moves through the place field with an inter-burst interval (see autocorrelogram in A) slightly shorter than the period of the concurrent EEG theta wave (shown in B). C) The result of this is that the timing of the spikes relative to the EEG cycle changes as the animal progresses through the field with each burst occurring at an earlier phase of the cycle. Adapted from O’Keefe and Recce (1993).
Figure 3
Figure 3
Phase precession, firing rate and field size. a) Phase precession occurs similarly on low- and high- firing rate runs. Runs through the place field were divided into two equal groups according to the number of spikes fired. Data are shown for one low-firing rate cell b) Rate of phase precession scales with field size. Explorable portion of linear track shown by vertical dotted lines. Phase of spikes is shown by dots and scale on right, firing rate by black/grey line and scale on left. Central 90% of the firing field was analysed, shown in grey. Adapted from Huxter et al. (2003).
Figure 4
Figure 4
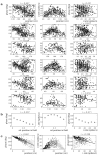
The relationship between the phase and instantaneous rate of place cell firing on a linear track may derive from the relationship of both firing phase and firing rate to the rat’s position. a) Scatter plots showing the relationship between phase and position, instantaneous rate (i. rate) and position, and phase and instantaneous rate for 6 CA1 place fields. Correlation coefficients (r) and associated regression lines, taking account of the circular nature of phase, show the greater range and strength of the variation of phase with position than with rate. See Huxter et al (2003) for details and for population summary statistics. b) Analysis of spikes pooled across cells, as in Harris et al., (2002), showing the relationship between phase and position, rate and position, and phase and rate (25158 spikes, 77 fields). Points show the appropriate (circular or linear) mean, error bars show the appropriate (circular or linear) standard error. Rat position data was scaled to reflect the proportion of the distance travelled through each field. These analyses combine the absolute phases of spikes from different cells relative to the theta rhythm in the EEG local to the cell, irrespective of cells’ different locations and overall firing rates. They replicate the relationship between phase and rate found by Harris et al (2002) (right), but suggest that it derives from the stronger and steeper correlation between phase and position (left), and the relationship between rate and position (middle). c) Simulation showing how a weaker and shallower regression of phase on rate can result from a stronger and steeper regression of phase on position. Note (right plot) that the late-field firing (light grey) influences the regression line less than the early-field firing (black) due to the increasing variation in phase with position (exaggerated here to clearly demonstrate the effect). The reliability of this subsidiary phase-rate correlation increases with the number of data points, explaining the stronger correlation for the pooled data (r = −0.37, see b) than the average correlation for the individual cells (mean r = −0.07, see Huxter et al., 2003). Data for phase φ and instantaneous rate r were simulated as functions of position in the place field x according to: {φ,r}={350250xL+75μ1xL,15(1-(2xL1)2)(μ2+2.5(1-(2xL1)2))}, where μ1 and μ2 are drawn from a unit Normal distribution and L is the length of the place field (shown as 40 cm). Adapted from Huxter et al (2003, supplementary Figure 1).
Figure 5
Figure 5
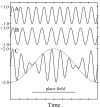
Interference pattern formed by the summation of 2 sinusoids of different frequencies. The wavelets will repeat at regular intervals. (Taken from(O’Keefe and Recce, 1993)).
Figure 6
Figure 6
3 grid cells recorded in the dorsocaudal medial entorhinal cortex. Left: scatter plots of spike locations (black) on the path of the rat (grey) of 3 nearby and simultaneously recorded grid cells. Middle: firing rate maps of the 3 grid cells. Right: the spike locations (above, in different colors: black, grey, light grey) and locations of peak firing rate (below) for the 3 cells shown together (labelled numerically). Nearby grid cells show aligned but slightly translated triangular grid-like firing patterns. Adapted from (Hafting et al., 2005).
Figure 7
Figure 7
Schematic of medial entorhinal grid cells as a substrate for path integration. a) Connections between grid cells with aligned but shifted grid-like firing patterns (see b) suitable for supporting path integration. The connections from one cell (the central, black cell) are shown (black arrows). It has connections to each neighbor that are modulated by input from head-direction cells (grey lines) tuned to the direction in which that cell’s firing pattern is shifted. This modulation might occur via interactions in the dendrite of the target cell, or via an expanded grid × direction representation elsewhere (modulation via running speed is also required). b) Locations of peak firing of the grid cells in part a (plus two more, grey and turquoise, for complete coverage). The grey arrow shows the movement corresponding to activation patterns shown in c). c) The changing pattern of activation when the rat moves as shown in a population of place cells (above: each one represented by a circle in the location corresponding to the location of its firing field), and in the 9 grid cells whose firing patterns are shown in b) (below: firing rates shown by a bar above each cell). The 9 East-modulated connection weights shown are sufficient to support continued path integration of ongoing Eastward movement of the rat. The connections between these 9 grid cells are repeatedly used to support path integration along any trajectory in any environment, allowing continual fine-tuning. Many more, much less frequently used, connections and cells would be required for path integration to be calculated in the CA3 place cell layer).
Figure 8
Figure 8
Relationship of grid cells to place cells and sensory input. Place cells are needed to read-out grid cell firing corresponding to a single location; to allow association of grid cell firing with the sensory input in a given location, to give a reliable correspondence between grid cells and the environment; to allow different grids to support each other (as connections between them are only valid at given places, connections between different grids need to be mediated by place cells). By associating place cells with the grid cells that happen to fire at the same location, place cells can serve both to read-out the result of path integration by sets of connected grid cells, and to enable it to be maintained in register with sensory input and with other sets of connected grid cells.

References

    1. Alonso A, Llinas RR. Subthreshold Na+-dependent theta-like rhythmicity in stellate cells of entorhinal cortex layer II. Nature. 1989;342:175–177. - PubMed
    1. Battaglia FP, Sutherland GR, McNaughton BL. Local sensory cues and place cell directionality: additional evidence of prospective coding in the hippocampus. J Neurosci. 2004;24:4541–4550. - PMC - PubMed
    1. Bullock TH, Buzsaki G, McClune MC. Coherence of compound field potentials reveals discontinuities in the CA1-subiculum of the hippocampus in freely-moving rats. Neuroscience. 1990;38:609–619. - PubMed
    1. Burgess N, Recce M, O’Keefe J. A model of hippocampal function. Neural Networks. 1994;7:1065–1081.
    1. Buzsaki G. Theta oscillations in the hippocampus. Neuron. 2002;33:325–340. - PubMed

Publication types