Comparative Study
. 2005 Sep 8:6:221.
doi: 10.1186/1471-2105-6-221.

GASH: an improved algorithm for maximizing the number of equivalent residues between two protein structures

Affiliations
Comparative Study

GASH: an improved algorithm for maximizing the number of equivalent residues between two protein structures

Daron M Standley et al. BMC Bioinformatics. .

Abstract

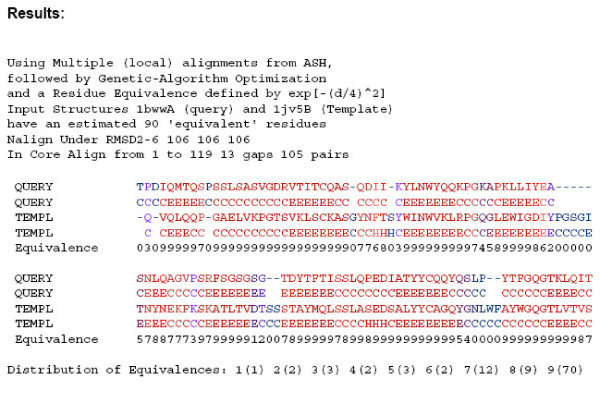
Background: We introduce GASH, a new, publicly accessible program for structural alignment and superposition. Alignments are scored by the Number of Equivalent Residues (NER), a quantitative measure of structural similarity that can be applied to any structural alignment method. Multiple alignments are optimized by conjugate gradient maximization of the NER score within the genetic algorithm framework. Initial alignments are generated by the program Local ASH, and can be supplemented by alignments from any other program.

Results: We compare GASH to DaliLite, CE, and to our earlier program Global ASH on a difficult test set consisting of 3,102 structure pairs, as well as a smaller set derived from the Fischer-Eisenberg set. The extent of alignment crossover, as well as the completeness of the initial set of alignments are examined. The quality of the superpositions is evaluated both by NER and by the number of aligned residues under three different RMSD cutoffs (2,4, and 6A). In addition to the numerical assessment, the alignments for several biologically related structural pairs are discussed in detail.

Conclusion: Regardless of which criteria is used to judge the superposition accuracy, GASH achieves the best overall performance, followed by DaliLite, Global ASH, and CE. In terms of CPU usage, DaliLite CE and GASH perform similarly for query proteins under 500 residues, but for larger proteins DaliLite is faster than GASH or CE. Both an http interface and a simple object application protocol (SOAP) interface to the GASH program are available at http://www.pdbj.org/GASH/.


Figures

Figure 1
Figure 1
GASH flowchart. A flow chart of the Global ASH/NER (OLD) and GASH (New) methods is shown. The key differences between the old and new methods are: the generation of multiple initial alignments, a modified parsing algorithm for generation of sub-alignments, and the further generation of hybrid alignments by crossover.
Figure 2
Figure 2
Alignment parsed by distance matrix. The parsing of a single local alignment into geometrically consistent sub alignments is illustrated. Only five sub-alignments are shown, and consecutive aligned residue pairs belonging to the same sub-alignment are represented by a single point in order to make the plot easier to see. The secondary structure (helices in blue and strands in red) is plotted along the axis.
Figure 3
Figure 3
Local and global alignments. The crossover operation is illustrated here by showing the final GASH alignment between 1sftB and 1ezwA. Four of the initial Local ASH alignments are shown as scatter plots, which are partially sampled by the final GASH alignment, as well as the Global ASH alignment.
Figure 7
Figure 7
Myoglobin aligned to Phycocyanobilin. Myoglobin (1mniA, query) aligned to Phycocyanin (1phnB, template). Residues that bind heme in 1mniA and phycocyanobilin in 1phnB are underlined, with matches indicated by a + and the total number of matches reported at the top of each alignment. The color scale used in this figure is identical to that of figure 6. The secondary structure assignments, residue equivalences, and terminal gaps have all been omitted in order to save space.
Figure 8
Figure 8
Carbamoyl phosphate synthetase aligned to methylglyoxal synthase. Carbamoyl phosphate synthetase (1bxrA, query) aligned to methylglyoxal synthase (1egh, template). Conserved residues in the methylglyoxal synthase-like superfamily are underlined, with matches indicated by a + and the total number of matches reported at the top of each alignment. The format used in this figure is identical to that of figure 7.
Figure 9
Figure 9
Alanine Racimase aligned to imidazole glycerol phosphate synthase. Alanine Racimase (1sftB, query) aligned to imidazole glycerol Phosphate synthase (1jvnA, template). A pair of function residues found the TIM barrel are underlined, with matches indicated by a + and the total number of matches reported at the top of each alignment. The format used in this figure is identical to that of figure 7.
Figure 10
Figure 10
Met8p aligned to flavohemoglobin. Met8p (1kyqB, query) aligned to Flavohemoglobin (1cqxA, template). The NAP(p)-binding loop residues are underlined, with matches indicated by a + and the total number of matches reported at the top of each alignment. The format used in this figure is identical to that of figure 7.
Figure 11
Figure 11
Immunoglobulin Light Chain Kappa Variable Domain aligned to antibody for phenobarbital. Immunoglobulin Light Chain Kappa Variable Domain (1bwwA, query) aligned to antibody for phenobarbital (1igyB, template). The characteristic disulfide bond and Thr residues are underlined, with matches indicated by a + and the total number of matches reported at the top of each alignment. The format used in this figure is identical to that of figure 7.
Figure 4
Figure 4
GASH alignment format. The alignment between 1bwwA and 1jv5B using default GASH is shown. In addition to the total NER score (eqn. 1), the residue-based similarity score (eqn. 2) was evaluated and scaled to integer values between 0 and 9. The distribution of such equivalences is reported at the bottom of the alignment. In order to roughly define the beginning and end of the most important parts of each alignment the first and last set of 5 continuous residues where the average similarity score was 5 or more was located. We refer to this region as the core alignment, and report the number of gaps and aligned residue pairs within the region. Also, the number of residues aligned under the three RMSD cutoffs, N2-6 are indicated. The alignments were written out with the residue pairs and secondary structure color coded by the similarity scale (with red the most and blue the least similar), making it easy to recognize regions of structural similarity.
Figure 5
Figure 5
Number of aligned residues under a given RMSD. The correlation between NER4 and the number of aligned residues under three cut-offs is shown. The entire set of alignments from 3,102 structure pairs and 7 alignment methods was used to make this plot. The slope between NER4 and the number of aligned residues under 2Å was 1.2 with a correlation coefficient of .97.
Figure 6
Figure 6
Default GASH vs. no crossover. The default GASH protocol is compared to GASH without crossover for 1gqeA (query) aligned to 1p32A (template). The NER equivalence (eqn. 2) is indicated numerically, on a 0–9 scale, and by color (with red the most and blue the least similar).

Similar articles

Cited by

References

    1. Berman HM, Westbrook J, Feng Z, Gilliland G, Bhat TN, Weissig H, Shindyalov IN, Bourne PE. The Protein Data Bank. Nucleic Acids Res. 2000;28:235–242. doi: 10.1093/nar/28.1.235. - DOI - PMC - PubMed
    1. Holm L, Sander C. Protein structure comparison by alignment of distance matrices. J Mol Biol. 1993;233:123–138. doi: 10.1006/jmbi.1993.1489. - DOI - PubMed
    1. Holm L, Sander C. Dictionary of recurrent domains in protein structures. Proteins. 1998;33:88–96. doi: 10.1002/(SICI)1097-0134(19981001)33:1<88::AID-PROT8>3.0.CO;2-H. - DOI - PubMed
    1. Shindyalov IN, Bourne PE. Protein structure alignment by incremental combinatorial extension (CE) of the optimal path. Protein Eng. 1998;11:739–747. doi: 10.1093/protein/11.9.739. - DOI - PubMed
    1. Gibrat JF, Madej T, Bryant SH. Surprising similarities in structure comparison. Curr Opin Struct Biol. 1996;6:377–385. doi: 10.1016/S0959-440X(96)80058-3. - DOI - PubMed

Publication types