. 2005 Jun 29;360(1458):1145-83.
doi: 10.1098/rstb.2005.1666.

The Ferrier Lecture 1995 behind the seen: the functional specialization of the brain in space and time

Affiliations

The Ferrier Lecture 1995 behind the seen: the functional specialization of the brain in space and time

Semir Zeki. Philos Trans R Soc Lond B Biol Sci. .

Abstract

The visual brain consists of many different visual areas, which are functionally specialized to process and perceive different attributes of the visual scene. However, the time taken to process different attributes varies; consequently, we see some attributes before others. It follows that there is a perceptual asynchrony and hierarchy in visual perception. Because perceiving an attribute is tantamount to becoming conscious of it, it follows that we become conscious of different attributes at different times. Visual consciousness is therefore distributed in time. Given that we become conscious of different visual attributes because of activity at different, functionally specialized, areas of the visual brain, it follows that visual consciousness is also distributed in space. Therefore, visual consciousness is not a single unified entity, but consists of many microconsciousnesses.


Figures

Figure 1
Figure 1
A section taken through the occipital lobe of the macaque monkey brain and stained with the Nissl method to reveal how cells are stacked upon one another to constitute the layered pattern of the cerebral cortex.
Figure 2
Figure 2
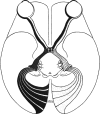
The projection from the retinas of the eyes to the striate cortex (stra; also known as area 17, primary visual cortex or V1). V1 is surrounded by a large expanse of cortex which was known as ‘association cortex’ but has been found to contain multiple visual areas. Reproduced from Polyak (1957).
Figure 3
Figure 3
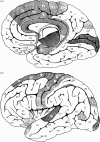
The primordial areas (shaded) and the ‘association’ areas (white) of the cerebral cortex, as charted by Paul Flechsig. (a) A medial view; (b) a lateral view. The occipital lobe, situated at the right, has uncertain geographical boundaries with the temporal and parietal areas. Reproduced from Flechsig (1920).
Figure 4
Figure 4
(a) The cytoarchitecture of the striate cortex (area V1) and the cortex lying in front of it, the prestriate cortex (arrow marks transition), shown in this horizontal section taken through the occipital lobe of the macaque monkey brain. (b) The visual areas of the prestriate cortex in the macaque monkey shown at the level of the section in (a).
Figure 5
Figure 5
The cytochrome oxidase architecture of area V1 (a) is characterized by a set of darkly staining ‘blobs’, which are separated from each other by more lightly staining ‘interblob’ regions. This architecture is best revealed when a section that is parallel to the surface is taken through area V1 (b) and stained for the metabolic enzyme. The tracing above shows the region of the occipital lobe from which the section in (b) was taken. (From Zeki 1993a.)
Figure 6
Figure 6
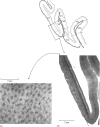
Area V2 of macaque monkey prestriate cortex surrounds area V1 and most of it lies buried within sulci. It is best revealed when the back of the brain is opened up. When a section through V2 is taken in the plane of the paper and stained for the metabolic enzyme cytochrome oxidase, the characteristic pattern of thick and thin stripes, separated by lightly staining interstripes, becomes evident. K=thick stripe; N=thin stripe; I=interstripe.
Figure 7
Figure 7
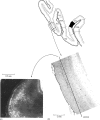
The patches of ‘direction selective’ cells in layer 4B of V1 projecting to area V5 seen in a section cut parallel to the cortical surface of V1 (a) and one perpendicular to it (b). This pattern is revealed when V5 is injected with the anatomical label horseradish peroxidase (in black on the tracing above). The label is transported retrogradely to V1, where it is seen within the projecting cells. (From Zeki 1993a.)
Figure 8
Figure 8
(a) The directional preferences of successive cells, separated from each other by small distances in a direction parallel to the cortical surface, in area V5. Note the orderly change in the successive directions of motion. (b) The directional preferences of successive cells lying perpendicular to the cortical surface of area V5. (From Zeki 1993a.)
Figure 9
Figure 9
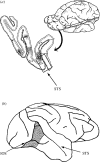
(a) The posterior part of the macaque monkey brain, as seen in a horizontal section taken at the level indicated. The boxed area is part of the V4 complex and has its distinctive callosal (interhemispheric) connections, shown by dots. At this level, it lies partly on the surface of the brain and extends onto the posterior bank of the superior temporal sulcus (STS). When traced ventrally, it appears on the surface of the brain anterior to the inferior occipital sulcus (IOS). (b) This area as it appears on the surface of the brain (stippling). This area is sometimes referred to as TEO, as if it were entirely separate from the V4 complex, which it is not. (From S. Zeki 1996.)
Figure 10
Figure 10
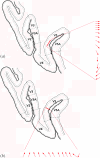
(a) The responses of macaque monkey brain to structured, multi-coloured Mondrians, revealed by imaging the activity in the brain of anaesthetized monkeys when they are presented with such stimuli, from which luminance differences have been eliminated. The activity (shown in red) is distributed in area V2 lying in the posterior bank of the lunate sulcus, and in both the upper and lower divisions of area V4. (b) While macaque V4 (purple, right) is distributed dorsoventrally, with the upper part representing lower visual fields and vice versa, human V4 (purple, left) is located within the ventral part of the occipital lobe, this being a ventral view. In human V4, located ventrally in the occipital lobe, lower visual fields are represented laterally and upper fields medially. It is as if the whole of macaque V4 has been displaced ventrally to give the human picture. (Both figures are from experiments of Alex Wade, Nikos Logothetis, A. Augath and Brian Wandell, and are reproduced here with permission of the authors.)
Figure 11
Figure 11
The human V4 complex, its two subdivisions and their retinotopic organization, as revealed in human imaging experiments. (a) The retinotopic organization in V4, with the lower field (green) being represented lateral to the upper field (red). This retinotopic organization is not evident in the anterior part of the V4 complex, V4α (bottom). (b) The results of an ICA, superimposed upon a brain imaging analysis. The ICA isolates the two subdivisions of the V4 complex as a single entity, showing that they form part of a single complex. (From Bartels & Zeki 2000.)
Figure 12
Figure 12
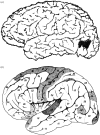
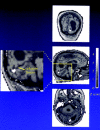
(a) The position of area V5, the visual motion centre, of the human brain revealed by an imaging study using positron emission tomography. (b) The position of area V5 coincides with Field 16 of Flechsig, which is myelinated at birth.
Figure 13
Figure 13
A diagrammatic representation of areas V1 and V2 and their compartments, as well as three areas of the visual brain. Layers 2 and 3 of V1 are characterized by metabolically active ‘blobs’ in which wavelength-selective cells are concentrated and, between them, the interblobs, which contain the orientation-selective cells. Directionally selective cells are concentrated in layer 4B. These compartments project in an orderly way to specific compartments of V2 (thick, thin and interstripes) and also to the more specialized areas of the prestriate cortex—V3, V4 and V5. (From Zeki 1993a.)
Figure 14
Figure 14
A diagram to show the lesions (stippling) in the hemiachromatopsic patient of Louis Verrey (1888).
Figure 15
Figure 15
The Kanizsa triangle.
Figure 16
Figure 16
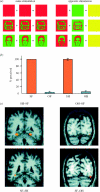
The experimental methods and the results from the experiments of Moutoussis & Zeki (2002b). (a) The dichoptically presented stimuli, with (on the left) the identical stimuli presented to the two eyes and (on the right) the same stimuli presented in opposite colour contrast. (b) Bars show that subjects were able to identify the stimuli correctly when the identical stimuli were delivered to the two eyes but were not able to do so when the two stimuli were of opposite colour contrast. (c) The average results from seven subjects, which shows that there was area-specific activation of the visual brain with both perceived and unperceived stimuli. The contrast same house versus same face (SH–SF) shows bilateral stimulus-specific activation in the parahippocampal gyrus. The contrast opposite house versus opposite face (OH–OF) shows unilateral stimulus-specific activation in the same region. The contrast same face versus same house (SF–SH) shows a stimulus-specific activation in the fusiform gyrus, while the contrast opposite face versus opposite house (OF–OH) reveals stimulus-specific activation in the same region. This experiment shows that processing sites are also perceptual sites.
Figure 17
Figure 17
A schematic of the motion (left) and colour (right) processing systems of primate visual cortex. Each system consists of at least three nodes. In the motion system, the cells of layer 4B of V1 that project, directly or through the thick stripes of V2, to V5 constitute one node. The thick stripes of V2 constitute another node and V5 the third node. Of these, V5 is the essential node for the perception of motion, but when destroyed, a residual motion vision can be signalled through the first two nodes, which then become essential nodes. In the colour system, the cells of the blobs in V1 that project directly or through the thin stripes of V2–V4 constitute one node, the thin and interstripes of V2 another node and V4 is yet another one. The latter is an essential node for colour vision, but when destroyed, the nodes projecting to it may assume this role.
Figure 18
Figure 18
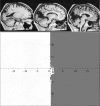
The activity (in white) in the brain of a patient who became blind after suffering a severe heart attack, but who could nevertheless discriminate colours. The activity is restricted to the territory of the calcarine sulcus (area V1) and is shown in saggital (centre), coronal (above) and horizontal sections (below). (From Zeki et al. 1999.)
Figure 19
Figure 19
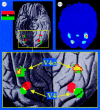
Independent components (ICs) containing visual areas; (a) BOLD signals correlations between their most active voxels (b) during the viewing of the first 22 min of the James Bond movie Tomorrow Never Dies. Data are from a single subject. (a) The glass-brain saggital and horizontal views of the positions of the isolated occipital ICs. All regions were stimulus driven and had significant and specific intersubject correlations. Labels indicate the locations of the ICs. The colouring of the ICs shows the relative voxel contribution, using the colour scale of (b), with red, green and blue indicating positive, neutral and negative contributions, respectively. (b) Correlogram to show the correlation (r) of BOLD signals between the most active voxels of areas identified in (a). The strength of correlation is indicated by the colour code and thickness of the line. LOp: posterior lateral occipital complex; LOI: lateral part of lateral occipital complex. (From Bartels & Zeki 2005.)
Figure 20
Figure 20
The hemianopic (left) hemifield of patient GY, with macular sparing (centre), and the causative lesion in the left occipital lobe (right) that he sustained during childhood.
Figure 21
Figure 21
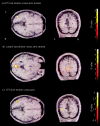
The results of imaging experiments on patient GY and normals. (a) The activity produced in the contrast fast motion (which GY is conscious of and can discriminate correctly) versus slow motion (which he is not conscious of and cannot discriminate). The activity, shown in yellow on horizontal sections (left) and coronal ones (right), is restricted to the territory of V5. (b) In normal subjects (who, unlike GY, have a V1), the activity is found in both V1 and V5. (c) The results of presenting GY with slow motion (which he is not aware of and cannot discriminate) and contrasting that with the grey screen. Now, activity is found again in V5. This suggests that, although signals reach V5 in the slow motion condition, they are not potent enough to elicit activity in V5 that is strong enough to result in a conscious correlate. (From Zeki & ffytche 1998.)
Figure 22
Figure 22
The results of comparing the activity produced in the brain of GY for stimuli that he reported to be aware of versus stimuli that he reported to be unaware of. The activity is located in the pontine reticular formation (in white) and is shown in transverse, coronal and saggital section, from above downwards. (From Zeki & ffytche 1998.)

Similar articles

Cited by

References

    1. Albright T.D. Direction and orientation selectivity of neurons in visual area MT of the macaque. J. Neurophysiol. 1984;52:1106–1130. - PubMed
    1. Allman J.M, Kaas J.H. Representation of the visual field in striate and adjoining cortex of the owl monkey (Aotus trivirgatus) Brain Res. 1971;35:89–106. - PubMed
    1. Arnold D.H, Clifford C.W. Determinants of asynchronous processing in vision. Proc. R. Soc. B. 2002;269:579–583. - PMC - PubMed
    1. Arnold D.H, Clifford C.W, Wenderoth P. Asynchronous processing in vision: color leads motion. Curr. Biol. 2001;11:596–600. - PubMed
    1. Barbur J.L, Watson J.D, Frackowiak R.S, Zeki S. Conscious visual perception without V1. Brain. 1993;116:1293–1302. - PubMed

Publication types

LinkOut - more resources