. 2005 Sep 7;25(36):8272-81.
doi: 10.1523/JNEUROSCI.1475-05.2005.

Ionic mechanisms underlying autonomous action potential generation in the somata and dendrites of GABAergic substantia nigra pars reticulata neurons in vitro

Affiliations

Ionic mechanisms underlying autonomous action potential generation in the somata and dendrites of GABAergic substantia nigra pars reticulata neurons in vitro

Jeremy F Atherton et al. J Neurosci. .

Abstract

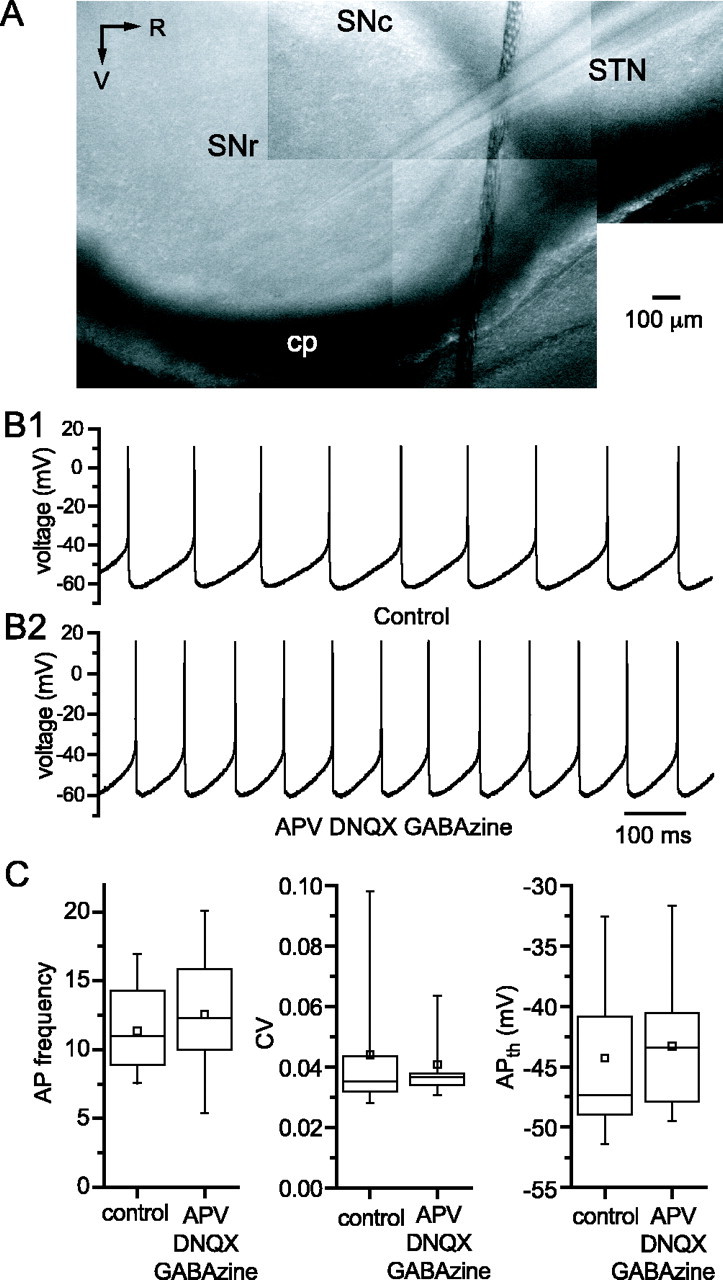
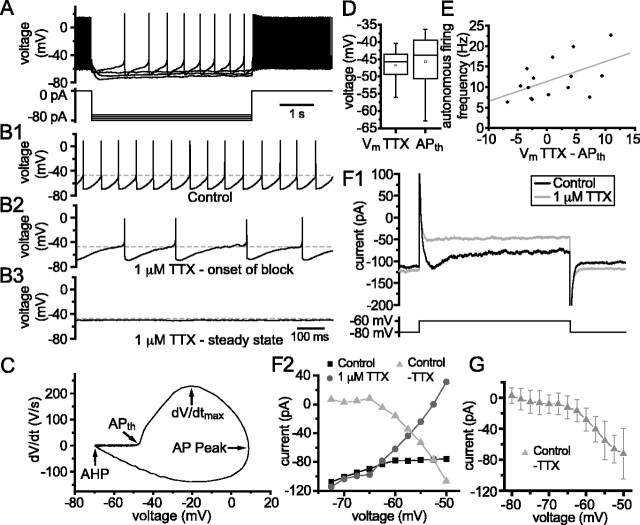
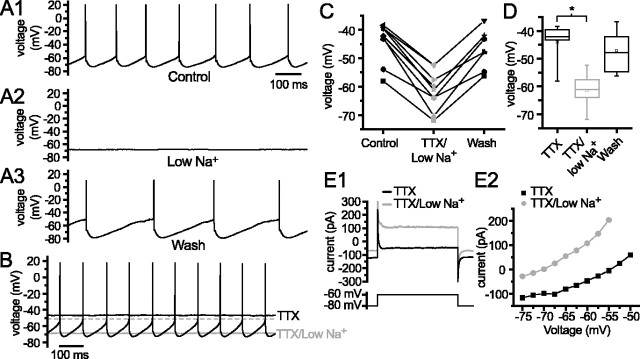
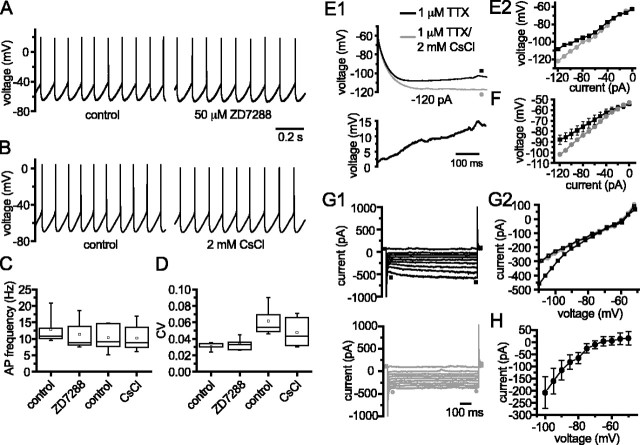
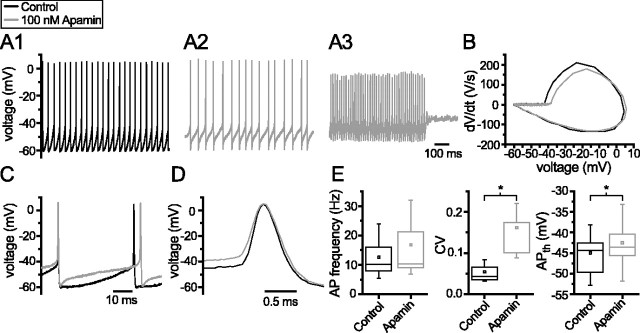
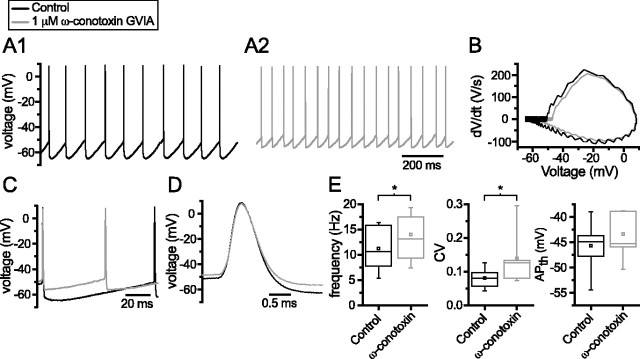
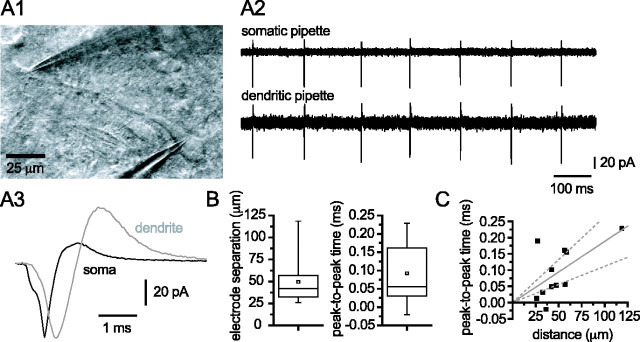
Through their repetitive discharge, GABAergic neurons of the substantia nigra pars reticulata (SNr) tonically inhibit the target nuclei of the basal ganglia and the dopamine neurons of the midbrain. As the repetitive firing of SNr neurons persists in vitro, perforated, whole-cell and cell-attached patch-clamp recordings were made from rat brain slices to determine the mechanisms underlying this activity. The spontaneous activity of SNr neurons was not perturbed by the blockade of fast synaptic transmission, demonstrating that it was autonomous in nature. A subthreshold, slowly inactivating, voltage-dependent, tetrodotoxin (TTX)-sensitive Na+ current and a TTX-insensitive inward current that was mediated in part by Na+ were responsible for depolarization to action potential (AP) threshold. An apamin-sensitive spike afterhyperpolarization mediated by small-conductance Ca2+-dependent K+ (SK) channels was critical for the precision of autonomous activity. SK channels were activated, in part, by Ca(2+) flowing throughomega-conotoxin GVIA-sensitive, class 2.2 voltage-dependent Ca2+ channels. Although Cs+/ZD7288 (4-ethylphenylamino-1,2-dimethyl-6-methylaminopyrimidinium chloride)-sensitive hyperpolarization-activated currents were also observed in SNr neurons, they were activated at voltages that were in general more hyperpolarized than those associated with autonomous activity. Simultaneous somatic and dendritic recordings revealed that autonomously generated APs were observed first at the soma before propagating into dendrites up to 120 microm from the somatic recording site. Backpropagation of autonomously generated APs was reliable with no observable incidence of failure. Together, these data suggest that the resting inhibitory output of the basal ganglia relies, in large part, on the intrinsic firing properties of the neurons that convey this signal.


Figures

Figure 1.
Figure 1.
The spontaneous activity of SNr neurons in vitro is not generated by synaptic inputs. A, Photomicrograph showing a sagittal rat brain slice with a patch electrode positioned in the SNr. cp, Cerebral peduncle; R, rostral; V, ventral. B, Perforated-patch current-clamp recordings from an SNr neuron. B1, Example of spontaneous activity recorded under control conditions. B2, Example showing autonomous firing from the same cell after the blockade of fast synaptic transmission by bath application of the antagonists APV, DNQX, and GABAzine. C, Box plots showing that the blockade of ionotropic glutamatergic and GABAergic synaptic transmission had no effect on the AP properties of nine SNr neurons. Application of APV, DNQX, and GABAzine had no statistically significant effects on AP frequency, CV, or APth.
Figure 2.
Figure 2.
Nav channels are necessary for the generation of autonomous rhythmic activity in SNr neurons. A, Perforated-patch current-clamp recording from an SNr neuron showing the response to 5 s injections of hyperpolarizing current. Four sweeps are superimposed showing the hyperpolarizing step that was just insufficient to terminate firing (–65 pA) and three additional steps (–70, –75, and –80 pA) during which firing was prevented. B, Rhythmic APs recorded in the whole-cell configuration (B1) were briefly disrupted (B2) and then completely terminated (B3) by bath application of 1 μm TTX. C, The rate of change of membrane potential (dV/dt) plotted against the membrane potential (phase plot). This phase plot is an average using all of the spikes shown in B1. The inflection denoting APth is indicated, as are the maximum rate of rise of the AP (dV/dtmax), the peak of the AP, and the most hyperpolarized point of the AHP. D, Box plots comparing APth before the application of TTX with the resting membrane potential in TTX (Vm TTX) for 15 cells. Vm TTX was not significantly different from APth. E, The magnitude of the difference between Vm TTX and APth is correlated with the frequency of autonomous firing before TTX application (r = 0.53; p < 0.05, Student's t test). F1, Whole-cell voltage-clamp recording showing the response of an SNr neuron to a 1 s depolarization to –60 mV from a holding potential of –80 mV. The solid black line shows the response under control conditions, and the gray line shows the response of the same cell to the same protocol after the application of 1 μm TTX. F2, Graph showing the steady-state (measured after 1 s) current–voltage relationship over a range of test voltages for the cell shown in F1. Black squares represent the control data, gray circles the currents in the presence of 1 μm TTX, and light gray triangles TTX subtracted currents. A TTX-sensitive current activated at voltages depolarized to approximately –62.5 mV. G, Mean ± SD steady-state current–voltage relationship for nine cells showing the presence of a subthreshold TTX-sensitive inward current.
Figure 3.
Figure 3.
SNr neurons are depolarized to APth, in part, by a TTX-insensitive inward current mediated, in part, by Na+. A, Reducing the external Na+ concentration blocks autonomous action potential generation. A1, Control whole-cell current-clamp recording from an SNr neuron in HEPES-buffered aCSF. A2, The same cell after the bath solution was changed to aCSF in which NMDG-Cl was substituted for NaCl ([NaCl] in control, 154.5 mm; [NaCl] in NMDG aCSF, 13.8 mm). The cell hyperpolarized and AP generation ceased. A3, After returning the cell to normal HEPES-buffered aCSF, firing was partially restored. B, Whole-cell current-clamp recordings from an SNr cell under control conditions and when Nav currents had been blocked by the application of 1 μm TTX. After 10 min of TTX application, the aCSF was exchanged for a low-Na+ aCSF (including TTX), resulting in the hyperpolarization of the cell by ∼20 mV (gray trace). APth under control conditions is marked by a dashed gray line. C, The reduction of external Na+ led to a hyperpolarization of the average membrane potential in 1 μm TTX in each of seven neurons tested. This effect was subsequently reversed by the restoration of the Na+ concentration in five of these neurons. D, Box plot representation of the data shown in C.*p < 0.05, low external Na+ resulted in a statistically significant hyperpolarization of the membrane potential in TTX. E, Whole-cell voltage-clamp recordings from an SNr neuron in the presence of 1 μm TTX in HEPES-buffered aCSF (black trace) or low-Na+ aCSF (gray trace). The traces shown are the response of the cell to a 1 s depolarization to –60 mV from a holding potential of –80 mV. When in low Na+, there was a positive shift in both the holding current and the current evoked during the depolarization. E2, Current–voltage relationship for the cell shown in E1, showing a positive shift in the relationship throughout the entire voltage range tested. Similar results were observed in each of three cells tested.
Figure 4.
Figure 4.
HCN channels do not contribute to autonomous firing. A, Autonomous activity of an SNr neuron recorded in the perforated patch configuration before and during bath application of 50 μm ZD7288. B, Autonomous activity of an SNr neuron recorded in the whole-cell configuration before and during bath application of 2 mm CsCl. C, D, Box plots showing the effects of ZD7288 and CsCl on AP frequency (C) and CV (D). E1, Response of an SNr neuron to a –120 pA hyperpolarizing current pulse before (black) and after (gray) the application of 2 mm CsCl. The bottom panel shows a subtraction of these two traces revealing that the increased hyperpolarization in response to –120 pA in the presence of CsCl develops slowly over the duration of the pulse. E2, Steady-state I–V relationship for the cell shown in A in thepresence of 1 μm TTX (black) or 1 μm TTX and 2 mm CsCl (gray). F, Steady state I–V relationship for six cells revealing an increase in input resistance during CsCl application at voltages below approximately –65 mV, as evidenced by the greater degree of hyperpolarization elicited by the same current steps. G1, Example of voltage-clamp recordings, in the presence of 1 μm TTX, showing a family of currents evoked by 1 s hyperpolarizing steps from a holding potential of –50 mV. At the most hyperpolarized potentials, a slowly activating inward current was evoked that could be blocked by 2 mm CsCl. G2, Example I–V plots of the early (open symbols) and late (filled symbols) currents recorded from the cell shown in G1. The early control currents (open black squares) overlay almost exactly with both the early (open gray circles) and late (filled gray circles) currents measured in CsCl. H, Mean CsCl-subtracted steady-state I–V plot for five cells.
Figure 5.
Figure 5.
Blockade of SK channels with apamin reduces the precision and modifies the frequency of firing of SNr neurons by reducing the single spike AHP. A, Whole-cell current-clamp recording from an SNr neuron before (A1) and during (A2) the application of 100 nm apamin. A3, In this neuron, and ∼40% of neurons tested, apamin eventually resulted in the cessation of AP firing through depolarization block. B, A comparison of phase plots from this neuron before and during the application of apamin revealed that APth and the maximal rate of rise of the AP were increased by apamin, presumably attributable to the decreased availability of Nav channels that accompanied depolarization. C, D, Expanded plots of firing from A1 and A2 illustrate the action of apamin on AP morphology and spike afterhyperpolarization. E, Box plots comparing the firing properties of eight SNr neurons before and during the application of apamin.
Figure 6.
Figure 6.
Blockade of voltage-dependent CaV2.2 channels reduces single-spike afterhyperpolarization. A, Perforated-patch clamp recording from an SNr neuron before (A1) and during (A2) the application of 1 μm ω-conotoxin GVIA. B, A comparison of phase plots constructed from APs before and during conotoxin application. Note the elevated APth and reduced maximal rate of rise of APs after the blockade of CaV2.2 channels. C, D, Expanded plots comparing the shapes of APs and spike AHP from A1 and A2. Note the elevated APth and the reduction in single-spike AHP after the blockade of CaV2.2 channels. E, Box plots comparing the firing properties of six SNr neurons before and during the application ofω-conotoxin GVIA. Although the precision of autonomous activity was significantly reduced after the blockade of Cav2.2 channels, the effect was not as profound as the disruption observed after the blockade of SK channels. Furthermore, the frequency of autonomous activity was significantly increased by the blockade of Cav2.2 channels in contrast to the effects observed after apamin application.
Figure 7.
Figure 7.
Autonomously generated APs propagate into the dendrites of SNr neurons. A1, Photomicrograph showing an infragradient-contrast image of an SNr neuron with patch pipettes on its soma and a dendrite. A2, Cell-attached voltage-clamp recordings (holding potential, 0 mV) from the soma and dendrite of the neuron shown in A1. Note the rhythmic, autonomous generation of action currents in the soma and dendrite. A3, Overlay of the average of 100 action currents recorded in the soma (black) and dendrite (gray). The somatic action current clearly precedes the dendritic action current. B, Box plots showing the range of soma-to-dendrite recording distances and peak-to-peak times for action currents in somata and dendrites. C, Plot of the relationship of the distance between the somatic and dendritic recording sites and the peak-to-peak time of action currents in the soma and dendrite. The dotted lines represent the 95% confidence interval of the linear fit. As predicted, the delay between the action currents measured in the soma and the dendrite increases with the distance between the recording sites.

References

    1. Alreja M, Aghajanian GK (1993) Opiates suppress a resting sodium-dependent inward current and activate an outward potassium current in locus coeruleus neurons. J Neurosci 13: 3525–3532. - PMC - PubMed
    1. Barry PH (1994) JPCalc, a software package for calculating liquid junction potential corrections in patch-clamp, intracellular, epithelial and bilayer measurements and for correcting junction potential measurements. J Neurosci Methods 51: 107–116. - PubMed
    1. Bennett BD, Callaway JC, Wilson CJ (2000) Intrinsic membrane properties underlying spontaneous tonic firing in neostriatal cholinergic interneurons. J Neurosci 20: 8493–8503. - PMC - PubMed
    1. Bentivoglio M, van der Kooy D, Kuypers HG (1979) The organization of the efferent projections of the substantia nigra in the rat. A retrograde fluorescent double labeling study. Brain Res 174: 1–17. - PubMed
    1. Beurrier C, Bioulac B, Hammond C (2000) Slowly inactivating sodium current (INaP) underlies single-spike activity in rat subthalamic neurons. J Neurophysiol 83: 1951–1957. - PubMed

Publication types