. 2005 Sep 7;25(36):8311-21.
doi: 10.1523/JNEUROSCI.1850-05.2005.

Combinatorial profiles of oligodendrocyte-selective classes of transcriptional regulators differentially modulate myelin basic protein gene expression

Affiliations

Combinatorial profiles of oligodendrocyte-selective classes of transcriptional regulators differentially modulate myelin basic protein gene expression

Solen Gokhan et al. J Neurosci. .

Abstract

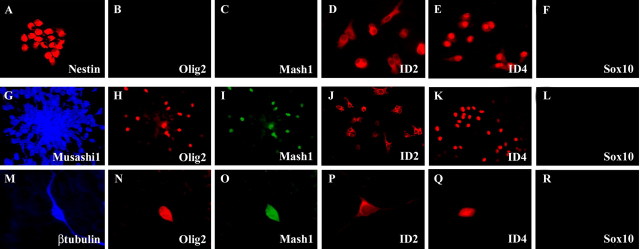
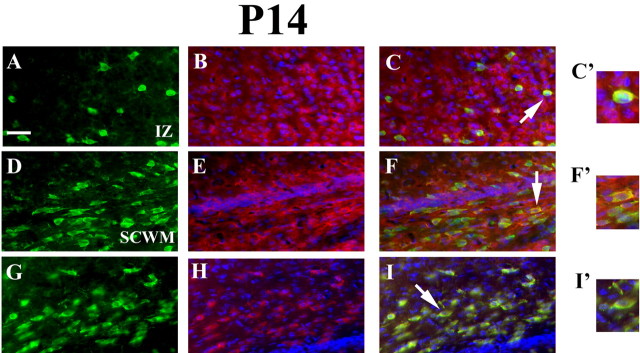
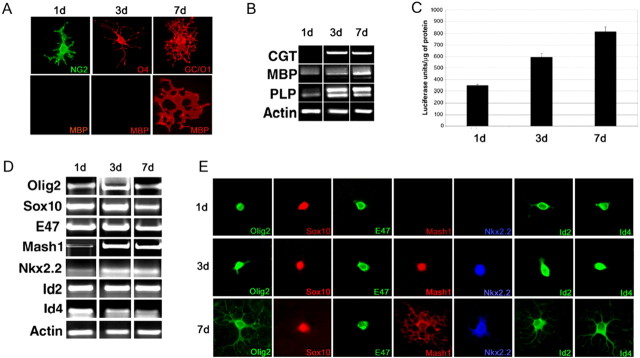
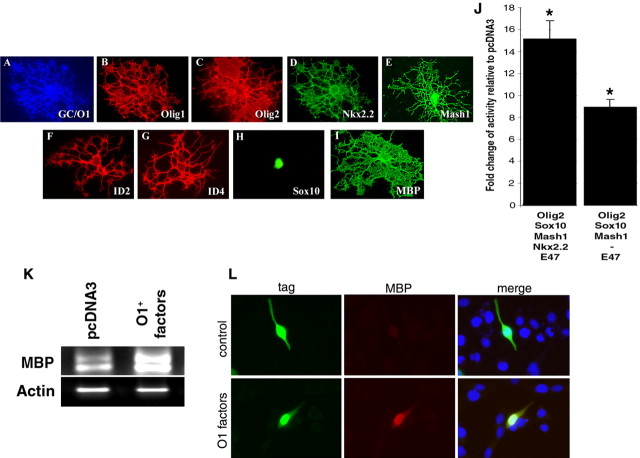
Recent studies suggest that specific neural basic helix-loop-helix (HLH; i.e., Olig1 and Olig2, Mash1), associated inhibitory HLH (i.e., Id2 and Id4), high-mobility group domain (i.e., Sox10), and homeodomain (i.e., Nkx2.2) transcription factors are involved in oligodendrocyte (OL) lineage specification and progressive stages of maturation including myelination. However, the developmental interplay among these lineage-selective determinants, in a cell- and maturational stage-specific context, has not yet been defined. We show here in vivo and in vitro developmental expression profiles for these distinct classes of transcriptional regulators of OLs. We show that progressive stages of OL lineage maturation are characterized by dynamic changes in the subcellular distribution of these transcription factors and by different permutations of combinatorial transcriptional codes. Transient transfections of these precise combinatorial codes with a luciferase reporter gene driven by the myelin basic protein promoter define how changes in the molecular composition of these transcriptional complexes modulate myelin gene expression. Our overall findings suggest that the dynamic interplay between developmental stage-specific classes of transcriptional activators and associated inhibitory factors orchestrate myelin gene expression during terminal maturation of the mammalian CNS.


Figures

Figure 1.
Figure 1.
Regional and temporal expression profiles of specific bHLH (Olig1, Olig2, and Mash1) and HD (Nkx2.2) transcription factors within the embryonic forebrain suggest complementary roles for Olig2 and Mash1 in ventral forebrain stem-cell lineage restriction and for Olig1 in OL lineage specification. A–D, Comparative immunofluorescence microscopy of Olig1 (A), Olig2 (B), Mash1 (C), and Nkx2.2 (D) protein expression in transverse (A1, B1, C1, D1) and coronal (A2, A3, B2, B3, C2, C3, D2, D3) sections of embryonic (E10, E13, and E17) mouse forebrain using Olig1, Olig2, Mash1, and Nkx2.2 antibodies. Olig1 is not expressed at early embryonic forebrain stages (A1, A2) and exhibits initial expression only at a time consistent with the developmental stage after tangential cortical migration within the cortical SVZ and cerebral cortex (CTX) (A3). In contrast, Olig2 is initially expressed within the MGE and LGE of the ventral forebrain at the time of tangential cortical migration (B2 vs B1) and within the cortical SVZ and CTX after tangential migration (B3). Mash1 is initially expressed before Olig2 in the early embryonic ventral forebrain (C1) and in a similar pattern to Olig2 in the MGE and LGE at the time of tangential cortical migration (C2). Like Olig2, Mash1 is expressed at a time consistent with the developmental stage after tangential cortical migration within the cortical SVZ and CTX (C3). In contrast, Nkx2.2 is transiently expressed in the early embryonic posterolateral region of the ventral forebrain (D1) and exhibits negligible expression in later stages of embryonic forebrain development (D2, D3).
Figure 2.
Figure 2.
Cellular expression profiles of Olig2 and Mash1 support complementary roles for these transcription factors in orchestrating neuronal–OL lineage restriction of ventral forebrain stem cells. A–R, Immunofluorescence microscopy analysis of transcription factor expression within neural progenitors derived from early embryonic ventral forebrain self-renewing multipotent progenitors (Nestin+; A) reveals the absence of Olig2 (B) and Mash1 (C) expression in these cells. However, Shh-mediated neuronal–OL lineage restriction in vitro is accompanied by the induction of nuclear expression of Olig2 (H) and Mash1 (I). These neuronal–OL progenitors (Musashi1+; G) sequentially give rise to βtubulin+ neuroblasts (M) that are the likely precursors of cortical GABAergic neurons and later to OL precursor species under the influence of developmentally modulated BMP signals (Yung et al., 2002). It is important to note that βtubulin+ neuroblasts exhibit nuclear expression of both Olig2 (N) and Mash1 (O). During these progressive stages of neuronal–OL lineage elaboration, inhibitory HLH proteins display consistent expression profiles in cytosolic (Id2; D, J, P) and nuclear (Id4; E, K, Q) compartments, respectively. In contrast, the expression of HMG protein Sox 10 was noted to be absent in all of these developmental stages (F, L, R).
Figure 3.
Figure 3.
Regional and temporal expression profiles of Olig1, Olig2, Mash1, Nkx2.2, and Sox10 during early postnatal cerebral cortical development suggest distinct roles for these transcription factors in OL lineage commitment and progressive OL maturation. A, B, Comparative immunofluorescence microscopy of Olig1, Olig2, Mash1, Nkx2.2, and Sox10 protein expression in coronal sections of early postnatal [P0 (A) and P6 (B)] mouse cerebral cortex (CTX) using Olig1, Olig2, Mash1, Nkx2.2, and Sox 10 antibodies reveals that although Olig1, Olig2, and Sox 10 are expressed in both the SVZ and CTX (A), Mash1 and Nkx2.2 expression is only detected in the developing CTX but not in the SVZ (A). However, during later stages of postnatal cortical development, both Mash1 and Nkx2.2 expression are detected within the subcortical white matter (SCWM) in parallel with the initiation of OL lineage maturation (B).
Figure 4.
Figure 4.
Cellular expression profiles of Id2, Id4, and Mash1 in OLs localized to the intermediate zone and the subcortical white matter of P14 mouse brain. A–I, Comparative immunofluorescence microscopy of Id2 (A–C), Id4 (D–F), and Mash1 (G, H) expression in coronal sections of P14 mouse cerebral cortex using Id2, Id4, and Mash1 antibodies in combination with the OL marker anti-APC mouse monoclonal antibody clone CC-1 reveals complete overlap of Id2 (C), Id4 (F), and Mash1 (I) at OL cell bodies. C′, F′, and I′ are high-resolution images of OL cell bodies displaying cytoplasmic staining for Id2, Id4, and Mash1. APC (FITC; A, D, G), Id2 (B), Id4 (E), and Mash1 (H; tetramethylrhodamine isothiocyanate) with Hoechst 33342 (UV) are shown. IZ, Intermediate zone; SCWM, subcortical white matter.
Figure 5.
Figure 5.
Characterization of the Oli-neu cells as a model system for studying myelin gene expression. Antigenic characterization of Oli-neu cells maintained in differentiating conditions for 1, 3, or 7 d. Immunocytochemistry with antibodies against NG2, O4, GalC, and MBP reveals the progressive acquisition of late OL differentiation markers. Note that the MBP can be detected only after 7 d in differentiation medium (A). Reverse transcription (RT)-PCR of RNA samples isolated from Oli-neu cells at the same stages of differentiation is shown. The cDNA is amplified with primers for CGT, MBP, and PLP and actin is used as an internal control. Note the very low levels of MBP and of the DM20 isoform of PLP detected at day 1. The levels of MBP expression increase after 3 d and 7 d in differentiation medium (B). The progressive expression of differentiation markers is also reflected in a progressive increase in the basal activity of a luciferase reporter gene driven by the MBP promoter (C). Immature Oli-neu cells were transfected with the reporter construct, and the cells were later induced to differentiate for 1, 3, and 7 d. Note the progressive increase in luciferase activity, reflecting the increase in basal promoter activity as the cells differentiated (C). The progressive increase in myelin gene expression was associated with a stage-specific pattern of expression of distinct families of transcription factors as detected by RT-PCR (D) and by immunocytochemistry (E).
Figure 6.
Figure 6.
The combinatorial transcriptional code expressed at the OL precursor stage of OL lineage elaboration is characterized by the presence of Olig2 and Sox10 and by the inhibitory activity of Id2 and Id4. Immunofluorescence microscopy of transcription factor expression in OL precursors derived from E17 cortical SVZ progenitors (A–J) reveals that NG2+/O4– OL precursors (A, F) express Olig2 (C), Id2 (G), Id4 (H), and Sox10 (I) but not Olig1 (B), Nkx2.2 (D), Mash1 (E), or MBP (J). When this combination of transcription factors is transiently transfected in the immature Oli-neu cells together with the MBP promoter driving a luciferase reporter gene, the result is a net activation of the promoter that is equivalent to that observed in cells transfected with Sox10 alone (K). In the absence of the inhibitory proteins Id2 and Id4, Olig2, and Sox10 are able to activate the promoter, thus suggesting that the NG2 developmental stage is characterized by the predominant inhibitory effect of the Ids. Each bar graph represents the mean of three to six experiments (*p < 0.0001).
Figure 7.
Figure 7.
The combinatorial transcriptional code expressed at the early OL progenitor stage of OL lineage elaboration is characterized by the presence of Olig1, Olig2, and Mash1 that together with Sox10 and E47 activate the MBP promoter even in the presence of Id2 and Id4. Immunofluorescence microscopy of transcription factor expression at the early O4+ OL progenitor stage (A, J) reveals the presence of Olig1 (B) and Olig2 (C) together with Mash1 (E), Id2 (G), Id4 (H), and Sox10 (I) in the absence of MBP staining(J). These cells continue to express NG2 (F). When the same combination of transcription factors is transiently transfected in the immature Oli-neu cells together with the MBP promoter driving a luciferase reporter gene (K), the result is a statistically significant (*p < 0.0001) activation of the promoter. In the absence of Id2 and Id4, the activity was even higher, thus suggesting that the presence of Olig1 and Mash1 renders the promoter more resilient to the inhibitory activity of the Id proteins. Each bar graph represents the average of six to nine independent determinations (K).
Figure 8.
Figure 8.
The HD transcription factor Nkx2.2 inhibits the activity of several combinations of transcription factors but only partially affects the activation induced by Olig1, Olig2, and Mash1 together with Sox10 and E47. At the later stages of differentiation, OL progenitors (NG2–/O4+) (A, F) begin to express Nkx2.2 (D), whereas they continue to express Olig1 (B), Olig2 (C), Mash1 (E), and Sox10 (I) in the nucleus. Please note the absence of MBP staining (J). Transfection of Nkx2.2 in immature Oli-neu cells together with Sox10 in the absence or presence of Olig1/Olig2/Mash1 or E47 with Olig1/Olig2/Mash1 results in a statistically significant (*p < 0.0001) repression of the MBP promoter activity, whereas together with Olig1, Olig2, Mash1, Sox10, and E47 it increases the MBP promoter activity (K).
Figure 9.
Figure 9.
Ectopic expression of factors detected at the GalC/O1+ stage is sufficient to induce MBP expression. A–I, At the GalC/O1+ postmitotic OL stage (A), the most dramatic changes observed are the cytoplasmic localization of Olig1 (B), Nkx2.2 (D), Id2 (F), and Id4 (G). Only Olig2 (C), Mash1 (E), and Sox10 (H) remain in the nucleus. The transfection of these combinations in immature Oli-neu cells result in a statistically significant increase in promoter activity (J) (*p < 0.001). The effect of the transfected combination of transcription factors on the endogenous promoter is indicated by the increased levels of MBP mRNA detected by semiquantitative reverse transcription-PCR (K). The increased MBP transcripts result also in increased expression of the MBP protein (L) as documented by immunocytochemistry. Note the presence of MBP immunoreactivity (red immunofluorescence) in immature Oli-neu cells transfected with the plasmids encoding for the factors expressed at the GalC/O1+ stage (O1+ factors) and not in cultures transfected with pcDNA3 encoding enhanced green fluorescent protein (EGFP; control). Transfected cells (green immunofluorescence) were identified by antibodies against GFP (for pcDNA3-EGFP-transfected cells) or against FLAG tag (for Olig2-FLAG-transfected cells).
Figure 10.
Figure 10.
Comparative effects of the precise combination of transcription factors specific for the MBP promoter when transfected into myelinating and non-myelinating cells and assessed for MBP and NeuroD promoter activation. The functional role of the specific combinations of positive transcription factors detected at each developmental stage was studied in a myelinating cell line (A, B) or in a fibroblastic cell line (C, D). Transient transfection of the same positive transcription factors detected during OL differentiation in NIH3T3(3T3) cells induced a pattern of MBP promoter activation, similar to that observed in the Oli-neu cells. This effect was specific for myelin genes because it was not observed on a neuronal promoter (NeuroD).

Similar articles

Cited by

References

    1. Alberta JA, Song-Kyu P, Mora J, Yuk D-i, Pawlitzky I, Iannarelli P, Vartanian T, Stiles CD, Rowitch DH (2001) Sonic hedgehog is required during an early phase of oligodendrocyte development in mammalian brain. Mol Cell Neurosci 18: 434–441. - PubMed
    1. Durand B, Raff M (2000) A cell-intrinsic timer that operates during oligodendrocyte development. BioEssays 22: 64–71. - PubMed
    1. Ericson J, Rashbass P, Schedl A, Brenner-Morton S, Kawakami A, van Heyningen V, Jessell TM, Briscoe J (1997) Pax6 controls progenitor cell identity and neuronal fate in response to graded Shh signaling. Cell 90: 169–180. - PubMed
    1. Gunhaga L, Jessell TM, Edlund T (2000) Sonic hedgehog signaling at gastrula stages specifies ventral telencephalic cell in the chick embryo. Development 127: 3283–3293. - PubMed
    1. He W, Ingraham C, Rising L, Goderie S, Temple S (2001) Multipotent stem cells from the mouse basal forebrain contribute GABAergic neurons and oligodendrocytes to the cerebral cortex during embryogenesis. J Neurosci 21: 8854–8862. - PMC - PubMed

Publication types

LinkOut - more resources