. 2006 Feb;95(2):619-26.
doi: 10.1152/jn.00682.2005. Epub 2005 Sep 7.

Hyperpolarization-activated cation current (Ih) is an ethanol target in midbrain dopamine neurons of mice

Affiliations

Hyperpolarization-activated cation current (Ih) is an ethanol target in midbrain dopamine neurons of mice

Takashi Okamoto et al. J Neurophysiol. 2006 Feb.

Abstract

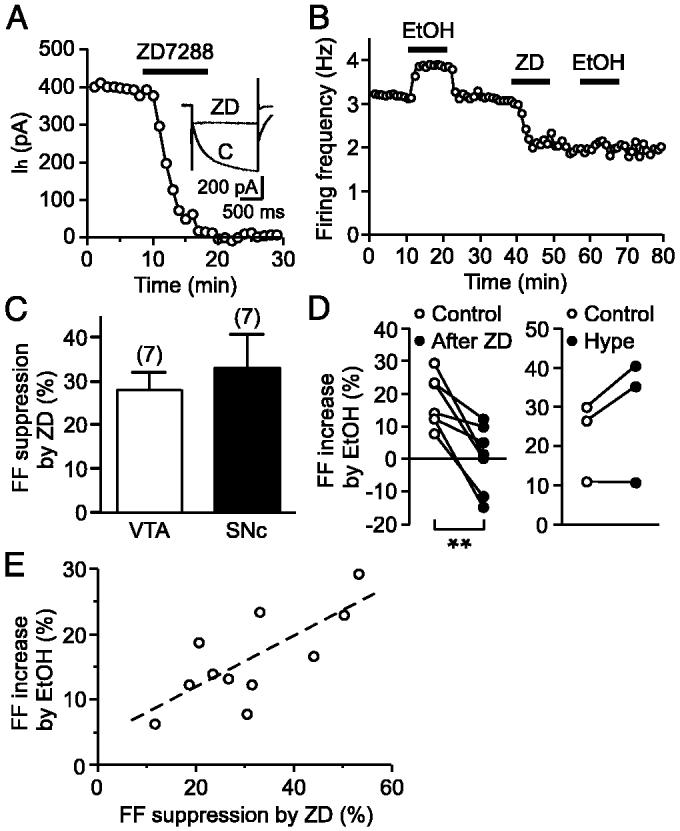
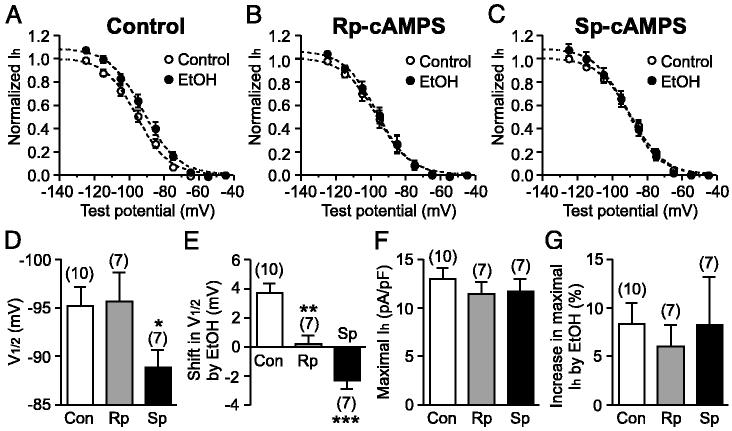
Ethanol stimulates the firing activity of midbrain dopamine (DA) neurons, leading to enhanced dopaminergic transmission in the mesolimbic system. This effect is thought to underlie the behavioral reinforcement of alcohol intake. Ethanol has been shown to directly enhance the intrinsic pacemaker activity of DA neurons, yet the cellular mechanism mediating this excitation remains poorly understood. The hyperpolarization-activated cation current, Ih, is known to contribute to the pacemaker firing of DA neurons. To determine the role of Ih in ethanol excitation of DA neurons, we performed patch-clamp recordings in acutely prepared mouse midbrain slices. Superfusion of ethanol increased the spontaneous firing frequency of DA neurons in a reversible fashion. Treatment with ZD7288, a blocker of Ih, irreversibly depressed basal firing frequency and significantly attenuated the stimulatory effect of ethanol on firing. Furthermore, ethanol reversibly augmented Ih amplitude and accelerated its activation kinetics. This effect of ethanol was accompanied by a shift in the voltage dependence of Ih activation to more depolarized potentials and an increase in the maximum Ih conductance. Cyclic AMP mediated the depolarizing shift in Ih activation but not the increase in the maximum conductance. Finally, repeated ethanol treatment in vivo induced downregulation of Ih density in DA neurons and an accompanying reduction in the magnitude of ethanol stimulation of firing. These results suggest an important role of Ih in the reinforcing actions of ethanol and in the neuroadaptations underlying escalation of alcohol consumption associated with alcoholism.


Figures

<sc>fig</sc>. 1.
fig. 1.
Ethanol facilitates dopamine (DA) neuron firing. A: time graph illustrating the effect of ethanol (100 mM) on DA neuron firing. This experiment was done with a perforated-patch configuration. Representative traces of action potential firing in control (C) and in ethanol (E) are shown in the inset. B: summary bar graph showing the effects of 50 and 100 mM ethanol. C: comparison of the effects of ethanol in the absence [Antg (-)] and presence [Antg (+)] of major neurotransmitter receptors. D: comparison of the effects of ethanol in the VTA and the SNc.
<sc>fig</sc>. 2.
fig. 2.
Ih is involved in ethanol stimulation of firing. A: time graph showing the effect of ZD7288 (30 μM) on Ih. Representative traces of Ih in control (C) and in ZD7288 (ZD) are shown in the inset. B: ZD7288 (30 μM) irreversibly decreased the firing frequency and blocked the effect of ethanol (100 mM). This experiment was performed with a cell-attached configuration. C: comparison of the effects of ZD7288 on the firing frequency in the VTA and the SNc. D: magnitude of ethanol-induced increase in the firing frequency (FF) before and after ZD7288 treatment (left) and hyperpolarizing current injection (right) is plotted in each cell. E: magnitude of ethanol-induced increase in FF is plotted vs. the magnitude of ZD7288-induced suppression. - - -, linear fit to the data. **P < 0.01.
<sc>fig</sc>. 3.
fig. 3.
Ethanol augments Ih in DA neurons. A, 1 and 2: representative traces (A1) and time graph (A2) depicting the effect of ethanol (100 mM) on Ih. The gray lines represent single-exponential fit to the activating phase of the current during the initial 500 ms of the voltage step. B: summary bar graph showing the effects of 50 and 100 mM ethanol on Ih. C: activation time constant of Ih is plotted before and after ethanol application in individual cells. **P < 0.01.
<sc>fig</sc>. 4.
fig. 4.
The effect of ethanol on Ih activation curve. A: representative traces of Ih evoked by a series of voltage steps as indicated. Traces before and during superfusion of ethanol (100 mM) are overlaid. Tail current amplitudes at -105 mV were measured at the time indicated by the arrow. B: tail current amplitudes, after subtraction of the current amplitude after no hyperpolarizing voltage step, are plotted versus the preceding test potentials. The dashed lines represent fit to a Boltzmann function. The data are from the same experiment as in A.
<sc>fig</sc>. 5.
fig. 5.
Ethanol enhancement of Ih has cAMP-dependent and -independent components. A-C: summary of the effects of ethanol on Ih activation curves in cells recorded with a control internal solution (n = 10; A), Rp-cAMPS (100 μM, n = 7; B), and Sp-cAMPS (100 μM, n = 7; C). In each cell, the current amplitudes were normalized to the control maximal amplitude in the absence of ethanol, which was estimated from the Boltzmann fit as shown in Fig. 4. - - -, Boltzmann fit to the averaged data. D-G: summary bar graphs showing the V1/2 value of Ih activation (D), ethanol-induced shift in V1/2 (E), the maximal Ih density (F), and ethanol-induced increase in maximal Ih (G) in cells recorded with a control solution (Con), Rp-cAMPS (Rp), and Sp-cAMPS (Sp). The maximal Ih amplitude, estimated from the Boltzmann fit, was divided by the cell capacitance to obtain the maximal Ih density in each cell. *P < 0.05, **P < 0.01, ***P < 0.001 vs. control.
<sc>fig</sc>. 6.
fig. 6.
Ih plasticity after repeated ethanol treatment in vivo. A-C: summary bar graphs depicting Ih density (A), V1/2 of Ih activation (B), and Ih activation time constant (C) in the VTA and the SNc for saline- and ethanol-treated mice. D: summary bar graph showing the input resistance in saline- and ethanol-treated mice. *P < 0.05 vs. saline.
<sc>fig</sc>. 7.
fig. 7.
The effects of ZD7288 and ethanol after repeated ethanol treatment in vivo. Summary bar graphs showing the basal firing frequency (FF; A), ZD7288-induced suppression of FF (B), ethanol-induced increase in FF (C), and ethanol-induced increase in Ih (D) for saline- and ethanol-treated mice. The data are shown separately for the VTA and the SNc in B. *P < 0.05 vs. saline.

Comment in

References

    1. Ahlenius S, Carlsson A, Engel J, Svensson T, Sodersten P. Antagonism by alpha methyltyrosine of the ethanol-induced stimulation and euphoria in man. Clin Pharmacol Ther. 1973;14:586–591. - PubMed
    1. Appel SB, Liu Z, McElvain MA, Brodie MS. Ethanol excitation of dopaminergic ventral tegmental area neurons is blocked by quinidine. J Pharmacol Exp Ther. 2003;306:437–446. - PubMed
    1. Asher O, Cunningham TD, Yao L, Gordon AS, Diamond I. Ethanol stimulates cAMP-responsive element (CRE)-mediated transcription via CRE-binding protein and cAMP-dependent protein kinase. J Pharmacol Exp Ther. 2002;301:66–70. - PubMed
    1. Brodie MS. Increased ethanol excitation of dopaminergic neurons of the ventral tegmental area after chronic ethanol treatment. Alcohol Clin Exp Res. 2002;26:1024–1030. - PubMed
    1. Brodie MS, Appel SB. The effects of ethanol on dopaminergic neurons of the ventral tegmental area studied with intracellular recording in brain slices. Alcohol Clin Exp Res. 1998;22:236–244. - PubMed

Publication types

LinkOut - more resources