Comparative Study
. 2006 Jan;95(1):379-400.
doi: 10.1152/jn.00498.2005. Epub 2005 Sep 7.

Responses of V1 neurons to two-dimensional hermite functions

Affiliations
Comparative Study

Responses of V1 neurons to two-dimensional hermite functions

Jonathan D Victor et al. J Neurophysiol. 2006 Jan.

Erratum in

  • J Neurophysiol. 2006 Aug;96(2):964

Abstract

Neurons in primary visual cortex are widely considered to be oriented filters or energy detectors that perform one-dimensional feature analysis. The main deviations from this picture are generally thought to include gain controls and modulatory influences. Here we investigate receptive field (RF) properties of single neurons with localized two-dimensional stimuli, the two-dimensional Hermite functions (TDHs). TDHs can be grouped into distinct complete orthonormal bases that are matched in contrast energy, spatial extent, and spatial frequency content but differ in two-dimensional form, and thus can be used to probe spatially specific nonlinearities. Here we use two such bases: Cartesian TDHs, which resemble vignetted gratings and checkerboards, and polar TDHs, which resemble vignetted annuli and dartboards. Of 63 isolated units, 51 responded to TDH stimuli. In 37/51 units, we found significant differences in overall response size (21/51) or apparent RF shape (28/51) that depended on which basis set was used. Because of the properties of the TDH stimuli, these findings are inconsistent with simple feedforward nonlinearities and with many variants of energy models. Rather, they imply the presence of nonlinearities that are not local in either space or spatial frequency. Units showing these differences were present to a similar degree in cat and monkey, in simple and complex cells, and in supragranular, infragranular, and granular layers. We thus find a widely distributed neurophysiological substrate for two-dimensional spatial analysis at the earliest stages of cortical processing. Moreover, the population pattern of tuning to TDH functions suggests that V1 neurons sample not only orientations, but a larger space of two-dimensional form, in an even-handed manner.


Figures

FIG. 1
FIG. 1
Two-dimensional Hermite (TDH) functions used in these experiments. Each family (Cartesian, left; polar, right) forms an orthonormal basis for 2-dimensional patterns and increases gradually in spatial extent and bandwidth as rank (row) increases. For the Cartesian functions, the indices j and k specify the number of zero-crossings along the x- and y-coordinates. Each index is constant along a set of parallel lines, as indicated by the arrows. Rank of a Cartesian function is equal to j + k. For the polar functions, the index ν specifies the number of zero-crossings along each radius and is constant along the inverted “vees” that begin at the bottom right, peak along the middle of the array, and then continue to the bottom left. Index μ specifies the number of zero-crossings along concentric circles and is constant along vertical lines as indicated by the down-pointing arrows. Rank of a polar function is equal to μ + 2v; the “cosine” and “sine” halves of the array contain the functions whose dependency on polar angle θ is given by cos (μθ) and sin (μθ), respectively, where θ is measured clockwise from the horizontal (x-) axis. Midline of the polar array contains the functions that are independent of θ.
FIG. 2
FIG. 2
Relationship of scaling of the TDH stimuli to the classical receptive field (RF) size. Left: diameter D of the classical RF for the target unit (diagrammed as unit 1) is taken to be the smallest inner diameter of an annulus that did not produce a measurable response (bottom left); other units (diagrammed as unit 2) might lead to a somewhat different choice of D and units might show increasing responses to patches of diameter >D (top). See METHODS for additional details. Parameter σ that defines the spatial spread of the TDH stimuli (see Eqs. A1, A2, A4, and A5) is then chosen as σ = D/10, which produces spatial profiles that are confined to a disk of radius D for low ranks, but extend beyond it for high ranks (right). h0 indicates the radial dependency of the TDH stimulus of rank 0 (common to Cartesian and polar separations); h7 indicates the dependency of the rank-7 Cartesian TDH C0,7 along its long axis.
FIG. 3
FIG. 3
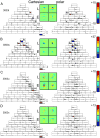
Poststimulus time histograms (PSTHs) of responses of 4 simultaneously recorded neurons in layer III of cat V1 to TDH functions (left; Cartesian stimuli; right polar stimuli), each presented for 250 ms and followed by 250 ms of mean illumination. In each pair of histograms, the top histogram is the response to the stimulus shown in Fig. 1, and the bottom histogram is the response to the contrast-inverse of that stimulus. Four pseudocolor maps represent the spatial filters Lcart, Lpolar, Ecart, and Epolar for the model of Fig. 4, derived as described by Eqs. 2 and 4. Circle on each color map is of diameter 42σ=0.56D (D is the diameter of the circle in Fig. 2), which marks the point at which the Gaussian component of each Hermite function falls to e−2 times its peak value. For each unit, a common linear pseudocolor scale (color bar as shown in top right) is used for the 4 filters, with green representing 0, red representing the highest positive value, and blue representing the lowest negative value. For the units of panels A and B, there is at least a qualitative similarity of the filters L and E deduced from the 2 basis sets. For the unit of panel C, the shapes of the filters differ substantially. For the unit of panel D, there is a difference in the relative strengths of the linear and nonlinear components (L < E for the Cartesian functions. L comparable to E for the polar functions). A, B, C, and D: units 3003t, s, u, and x. PSTH scale bar: 100 impulses/s in all panels. Range for pseudocolor maps of filters: ±10 impulses/s (A), ±37 impulses/s (B), ±10 impulses/s (C), and ±13 impulses/s (D).
FIG. 4
FIG. 4
Filter-then-rectify framework for analyzing responses to Cartesian and polar TDH stimuli. L and E represent spatial filters; E is followed by full-wave rectification. This model is used to deduce the filter maps presented in Figs. 3, 5, and 6. For further details, see text.
FIG. 5
FIG. 5
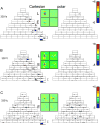
PSTHs of responses of 3 simultaneously recorded neurons in upper layer V1/lower V of cat VI to TDH functions. Data are displayed as in Fig. 3. Units of A and B respond nearly exclusively to the Cartesian stimuli; the unit of C responds in a similar fashion to both basis sets. A, B, and C: units 3303s, t, and u. PSTH scale bar: 75 impulses/s in A and B, 50 impulses/s in C. Range for pseudocolor maps of filters: ±6 impulses/s (A), ±8 impulses/s (B), and ±5 impulses/s (C).
FIG. 6
FIG. 6
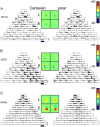
PSTHs of responses of 4 neurons at separate locations in macaque V1. Data are displayed as in Fig. 3. For the unit of A, but not for the other units, the filters L and E deduced from the 2 basis sets are similar. A, B, and C: units 5013s, 5007t, and 5008s. PSTH scale bar: 150 impulses/s in A and B, 75 impulses/s in C. Range for pseudocolor maps of filters: ±60 impulses/s (A), ±40 impulses/s (B), and ±50 impulses/s (C).
FIG. 7
FIG. 7
Distribution of the index Ishape (Lcart, Lpolar) (Eq. 8). Values <1 indicate different effective filtering behavior for Cartesian and polar stimuli. Portions of the histograms shaded black represent units for which values were significantly (by jackknife) <1 at P < 0.01; portions shaded gray are significant at 0.01 at P < 0.05; unshaded portions correspond to P > 0.05. Each panel contains calculations based on a different response measure.
FIG. 8
FIG. 8
Best orientation (deg) (A) and spatial frequency (c/deg) (B) as determined by Fourier transformation of the maps of the spatial filters Lcart and Lpolar. Error bars are 95% confidence limits determined by jackknife, and data are plotted only for units in which there was a well-defined best orientation or spatial frequency. There was a modest (rcirc = 0.44, P < 0.02) correlation between estimate the best orientation and no correlation between the estimated best spatial frequencies. See text for details.
FIG. 9
FIG. 9
Distribution of relative responsiveness to Cartesian and polar stimuli, Ic-p (Eq. 11). Values >0 indicate larger responses to Cartesian stimuli; values <0 indicate larger responses to polar stimuli. Significance levels calculated by jackknife and are shown as in Fig. 7. Each panel contains calculations based on a different response measure.
FIG. 10
FIG. 10
Distribution of kurtosis of responses to the Cartesian and polar stimuli, γc and γp (Eq. 12). These distributions are not significantly different by parametric or nonparametric tests, indicating the absence of an overall tendency for neurons to be more narrowly tuned to one stimulus set or the other.
FIG. 11
FIG. 11
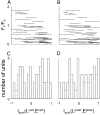
Relationship of indices of overall nonlinearity Isym(L, E) (Eq. 5) determined from Cartesian (A) and polar (B) responses to the F1/F0 ratio used to classify cells as simple and complex. For both Cartesian and polar measurements, units with Isym close to 1 tended to have small values (“complex”) of the F1/F0 ratio. C and D: distribution of these indices across the population. The distributions for Cartesian and polar responses are similar.
FIG. 12
FIG. 12
Distribution of the indices Ishape(Lcart, E cart) and Ishape(Lpolar, E polar) (Eq. 10). Values near 1 indicate consistency with a single-pathway linear–nonlinear (LN) model; significant departures from 1 indicate that spatial differences in the 2 filters L and E of Fig. 4 are required to account for the data within a single basis set. Significance levels (for Ishape <1) indicated as in Fig. 7. Each column contains calculations based on a different response measure.
FIG. 13
FIG. 13
Principal components analysis of response dynamics. A: first principal component in response to Cartesian (top row) and polar (bottom row) stimuli. Analyses are carried out separately for each unit and superimposed. Heavy lines in the top 2 rows are the averages within each preparation; the 3rd row compares these averages (Cartesian: black; polar: gray). B: first 4 principal components, averaged across all preparations, displayed as in the 3rd row of A. Although there is much cell-to-cell and preparation-to-preparation variation in the time course of the responses, the time course of the responses elicited by Cartesian and polar stimuli are nearly identical, as seen by the near-superposition of their principal components.
FIG. 14
FIG. 14
Distribution of response size index Jc-p (Eq. 22). Values >0 indicate that the response to Cartesian stimuli (relative to polar stimuli) is greater than predicted by an energy model; values <0 indicate the opposite. Significance levels calculated and shown as in Fig. 9.

Similar articles

Cited by

References

    1. Abramowitz M, Stegun IA. Handbook of Mathematical Functions. Washington, DC: U.S. Department of Commerce, National Bureau of Standards; 1964. reprint, New York: Dover, 1970.
    1. Adelson EH, Bergen JR. Spatiotemporal energy models for the perception of motion. J Opt Soc Am A. 1985;2:284–299. - PubMed
    1. Albright TD, Stoner GR. Contextual influences on visual processing. Annu Rev Neurosci. 2002;25:339–379. - PubMed
    1. Anderson JS, Lampl I, Gillespie DC, Ferster D. Membrane potential and conductance changes underlying length tuning of cells in cat primary visual cortex. J Neurosci. 2001;21:2104–2112. - PMC - PubMed
    1. Aronov D, Reich DS, Mechler F, Victor JD. Neural coding of spatial phase in V1 of the macaque monkey. J Neurophysiol. 2003;89:3304–3327. - PubMed

Publication types

LinkOut - more resources