. 2005 Nov 1;102(44):15728-35.
doi: 10.1073/pnas.0506356102. Epub 2005 Sep 6.

Probabilistic assessment of "dangerous" climate change and emissions pathways

Affiliations

Probabilistic assessment of "dangerous" climate change and emissions pathways

Stephen H Schneider et al. Proc Natl Acad Sci U S A. .

Abstract

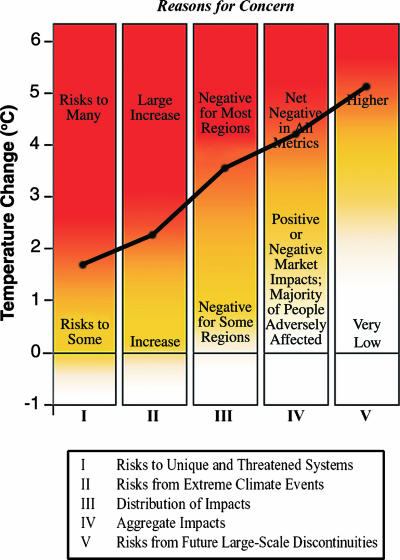
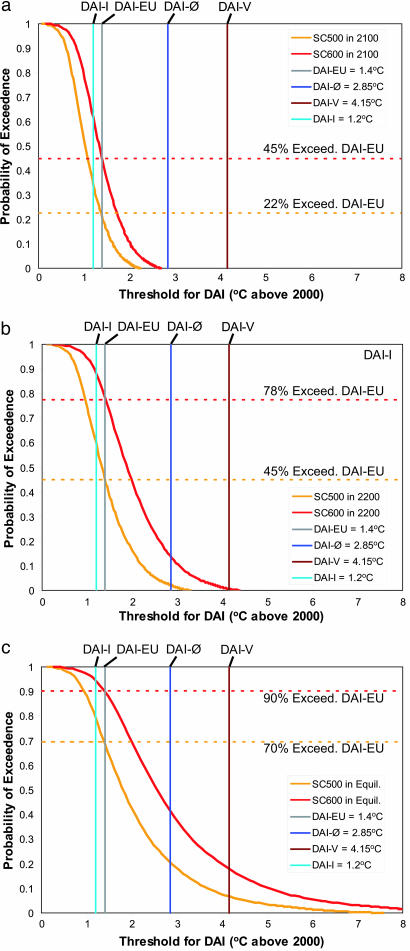
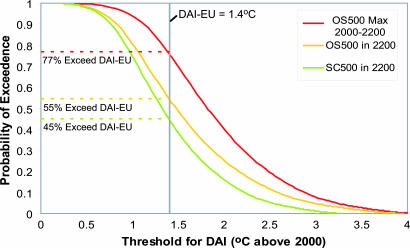
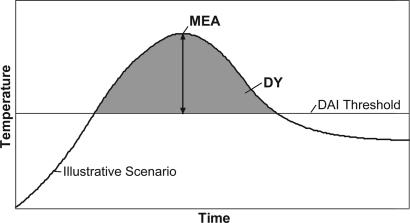
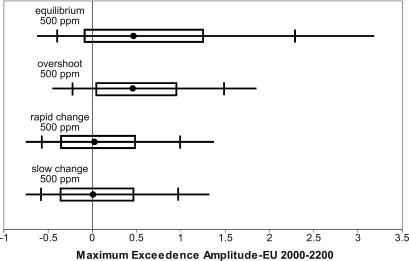
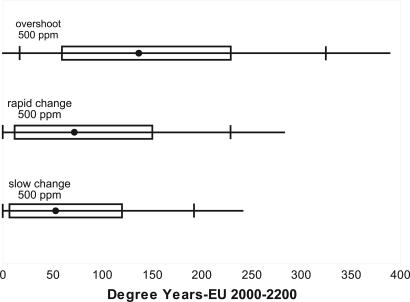
Climate policy decisions driving future greenhouse gas mitigation efforts will strongly influence the success of compliance with Article 2 of the United Nations Framework Convention on Climate Change, the prevention of "dangerous anthropogenic interference (DAI) with the climate system." However, success will be measured in very different ways by different stakeholders, suggesting a spectrum of possible definitions for DAI. The likelihood of avoiding a given threshold for DAI depends in part on uncertainty in the climate system, notably, the range of uncertainty in climate sensitivity. We combine a set of probabilistic global average temperature metrics for DAI with probability distributions of future climate change produced from a combination of several published climate sensitivity distributions and a range of proposed concentration stabilization profiles differing in both stabilization level and approach trajectory, including overshoot profiles. These analyses present a "likelihood framework" to differentiate future emissions pathways with regard to their potential for preventing DAI. Our analysis of overshoot profiles in comparison with non-overshoot profiles demonstrates that overshoot of a given stabilization target can significantly increase the likelihood of exceeding "dangerous" climate impact thresholds, even though equilibrium warming in our model is identical for non-overshoot concentration stabilization profiles having the same target.


Figures

Fig. 1.
Fig. 1.
An adaptation of the IPCC reasons for concern figure from ref. , with the thresholds used to generate our CDF for DAI-Ø. Five reasons for concern are conceptualized, mapped against global temperature increase. As temperature increases, colors become redder, indicating increasingly widespread and/or more severe negative impacts. We use the transition-to-red thresholds for each reason for concern to construct a CDF for DAI-Ø.
Fig. 2.
Fig. 2.
Comparison of the probability of exceedence of the indicated thresholds for DAI for two concentration profiles, one stabilizing at 500 ppm CO2e (SC500) and one stabilizing at 600 ppm CO2e (SC600). (a and b) Probabilities of exceedence for transient temperature increase above 2000 in 2100 (a) and 2200 (b). (c) Probabilities of exceedence in equilibrium. The curves are generated from PDFs for future temperature increase generated by running the simple climate model described in Climate Modeling for each concentration profile, sampling from the PDFs for climate sensitivity used in this article. As reported in the text, probabilities of exceedence of the DAI-EU threshold are indicated.
Fig. 3.
Fig. 3.
Comparison of the probability of exceedence of the DAI-EU threshold for overshoot (OS500) and nonovershoot (SC500) concentration profiles stabilizing at 500 ppm CO2e. The green and yellow curves display probabilities of exceedence for transient temperature increase above 2000 in 2200, and the red curve displays probabilities of exceedence for the maximum temperature reached sometime between 2000 and 2200 for the overshoot (OS500) concentration profile. Although there is only a modest increase in the probability of exceedence of the DAI-EU threshold in 2200 under the two profiles, there is a significant increase in the probability of at least a temporary exceedence of the DAI-EU threshold before 2200.
Fig. 4.
Fig. 4.
Visual representation of the MEA and DY metrics. We introduce these tools to differentiate emissions pathways by the degree to which they exceed thresholds for DAI. For the illustrative temperature profile displayed here, MEA is measured as the maximum temperature increase reached above the indicated threshold for DAI (horizontal gray line), and DY is measured as the cumulative exceedence of that threshold by the profile (gray shading).
Fig. 5.
Fig. 5.
Box-and-whisker diagrams for the MEA above the DAI-EU threshold, MEA-EU. The diagrams indicate the 95% confidence interval (full horizontal line), 90% confidence interval (vertical tick marks), 50% confidence interval (box), and median value (dot). The lower three diagrams display the distribution of MEA-EU between 2000 and 2200 for the three concentration profiles stabilizing at 500 ppm CO2e. For comparison, the top box-and-whisker diagram displays the MEA-EU distribution in equilibrium for stabilization of 500 ppm CO2e. The overshoot concentration profile increases the median and overall range for MEA-EU, compared with the nonovershoot profiles.
Fig. 6.
Fig. 6.
Box-and-whisker diagrams for DY above the DAI-EU threshold, DY-EU. The diagrams indicate the 95% confidence interval (full horizontal line), 90% confidence interval (vertical tick marks), 50% confidence interval (box), and median value: The diagrams display the distribution of DY-EU between 2000 and 2200 for the three concentration profiles stabilizing at 500 ppm CO2e. The overshoot concentration profile increases both the median and variance of the DY-EU distribution, compared with the nonovershoot profiles.

References

    1. United Nations Framework Convention on Climate Change (1992) United Nations Framework Convention on Climate Change (United Nations, New York).
    1. Patwardhan, A., Schneider, S. H. & Semenov, S. M. (2003) Assessing the Science to Address UNFCCC Article 2 (Intergovernmental Panel on Climate Change, Geneva).
    1. Smith, J. B., Schellnhuber, H.-J., Mirza, M. M. Q., Fankhauser, S., Leemans, R., Erda, L., Ogallo, L., Pittock, B., Richels, R., Rosenzweig, C., et al. (2001) in Climate Change 2001: Impacts, Adaptation, and Vulnerability: Contribution of Working Group II to the Third Assessment Report of the Intergovernmental Panel on Climate Change, eds. McCarthy, J. J., Canziani, O. F., Leary, N. A., Dokken, D. J. & White, K. S. (Cambridge Univ. Press, Cambridge, U.K.), pp. 913-967.
    1. Manne, A. S. & Richels, R. G. (1995) Energy J. 16, 1-37.
    1. Hammitt, J. K., Lempert, R. J. & Schlesinger, M. E. (1992) Nature 357, 315-318.

Publication types

LinkOut - more resources