Sequential compound exocytosis of large dense-core vesicles in PC12 cells studied with TEPIQ (two-photon extracellular polar-tracer imaging-based quantification) analysis
- PMID: 16150797
- PMCID: PMC1464190
- DOI: 10.1113/jphysiol.2005.094003
Sequential compound exocytosis of large dense-core vesicles in PC12 cells studied with TEPIQ (two-photon extracellular polar-tracer imaging-based quantification) analysis
Abstract
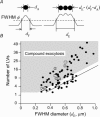
We investigated exocytosis of PC12 cells using two-photon excitation imaging and extracellular polar tracers (TEP imaging) at the basal region of PC12 cells adjacent to the glass cover slip. TEPIQ (two-photon extracellular polar-tracer imaging-based quantification) analysis revealed that most exocytosis was mediated by large dense-core vesicles (LVs) with a mean diameter of 220 nm, and that exocytosis of LVs occurred slowly with a mean latency of approximately 7 s even though exocytosis was induced with large increases in cytosolic Ca2+ concentration by uncaging of a caged-Ca2+ compound. We also found that 97% of exocytic LVs remained poised at the plasma membrane, 72% maintained their fusion pores in an open conformation for more than 30 s, and 76% triggered sequential compound exocytosis of vesicles that were located deeper in the cytosol. Sequential compound exocytosis by PC12 cells was confirmed by electron microscopic investigation with photoconversion of diaminobenzidine by FM1-43 (a polar membrane tracer). Our data suggest that pre-stimulus docking of LVs to the plasma membrane does not necessarily hasten the fusion reaction, while docking and resulting stability of exocytic LVs facilitates sequential compound exocytosis, and thereby allowing mobilization of deep vesicles.
Figures


Similar articles
-
Exocytosis and endocytosis of small vesicles in PC12 cells studied with TEPIQ (two-photon extracellular polar-tracer imaging-based quantification) analysis.J Physiol. 2005 Nov 1;568(Pt 3):917-29. doi: 10.1113/jphysiol.2005.094011. Epub 2005 Sep 8. J Physiol. 2005. PMID: 16150796 Free PMC article.
-
A new quantitative (two-photon extracellular polar-tracer imaging-based quantification (TEPIQ)) analysis for diameters of exocytic vesicles and its application to mouse pancreatic islets.J Physiol. 2005 Nov 1;568(Pt 3):891-903. doi: 10.1113/jphysiol.2005.093047. Epub 2005 Sep 8. J Physiol. 2005. PMID: 16150799 Free PMC article.
-
Two-photon excitation imaging of exocytosis and endocytosis and determination of their spatial organization.Adv Drug Deliv Rev. 2006 Sep 15;58(7):850-77. doi: 10.1016/j.addr.2006.07.008. Epub 2006 Aug 14. Adv Drug Deliv Rev. 2006. PMID: 16996640
-
Living cell functions and morphology revealed by two-photon microscopy in intact neural and secretory organs.Mol Cells. 2008 Aug 31;26(2):113-20. Epub 2008 Jun 26. Mol Cells. 2008. PMID: 18594180 Review.
-
Exocytic process analyzed with two-photon excitation imaging in endocrine pancreas.Endocr J. 2007 Jun;54(3):337-46. doi: 10.1507/endocrj.kr-94. Epub 2007 Apr 3. Endocr J. 2007. PMID: 17409577 Review.
Cited by
-
Exocytosis and endocytosis of small vesicles in PC12 cells studied with TEPIQ (two-photon extracellular polar-tracer imaging-based quantification) analysis.J Physiol. 2005 Nov 1;568(Pt 3):917-29. doi: 10.1113/jphysiol.2005.094011. Epub 2005 Sep 8. J Physiol. 2005. PMID: 16150796 Free PMC article.
-
Vacuolar sequential exocytosis of large dense-core vesicles in adrenal medulla.EMBO J. 2006 Feb 22;25(4):673-82. doi: 10.1038/sj.emboj.7600983. Epub 2006 Feb 9. EMBO J. 2006. PMID: 16467850 Free PMC article.
-
Regulation of fusion pore closure and compound exocytosis in neuroendocrine PC12 cells by SCAMP1.Traffic. 2011 May;12(5):600-14. doi: 10.1111/j.1600-0854.2011.01170.x. Epub 2011 Feb 25. Traffic. 2011. PMID: 21272170 Free PMC article.
-
Simultaneous ultrastructural analysis of fluorochrome-photoconverted diaminobenzidine and gold immunolabelling in cultured cells.Eur J Histochem. 2013 Sep 16;57(3):e26. doi: 10.4081/ejh.2013.e26. Eur J Histochem. 2013. PMID: 24085275 Free PMC article.
-
A new quantitative (two-photon extracellular polar-tracer imaging-based quantification (TEPIQ)) analysis for diameters of exocytic vesicles and its application to mouse pancreatic islets.J Physiol. 2005 Nov 1;568(Pt 3):891-903. doi: 10.1113/jphysiol.2005.093047. Epub 2005 Sep 8. J Physiol. 2005. PMID: 16150799 Free PMC article.
References
-
- Anderson P, Slorach SA, Uvnas B. Sequential exocytosis of storage granules during antigen-induced histamine release from sensitized rat mast cells in vitro. An electron microscopic study. Acta Physiol Scand. 1973;88:359–372. - PubMed
-
- Angleson JK, Cochilla AJ, Kilic G, Nussinovitch I, Betz WJ. Regulation of dense core release from neuroendocrine cells revealed by imaging single exocytic events. Nat Neurosci. 1999;2:440–446. - PubMed
Publication types
MeSH terms
LinkOut - more resources
Full Text Sources
Miscellaneous

