. 2005 Dec;89(6):4261-74.
doi: 10.1529/biophysj.105.065581. Epub 2005 Sep 8.

Effect of temperature on the nanomechanics of lipid bilayers studied by force spectroscopy

Affiliations

Effect of temperature on the nanomechanics of lipid bilayers studied by force spectroscopy

Sergi Garcia-Manyes et al. Biophys J. 2005 Dec.

Abstract

The effect of temperature on the nanomechanical response of supported lipid bilayers has been studied by force spectroscopy with atomic force microscopy. We have experimentally proved that the force needed to puncture the lipid bilayer (Fy) is temperature dependent. The quantitative measurement of the evolution of Fy with temperature has been related to the structural changes that the surface undergoes as observed through atomic force microscopy images. These studies were carried out with three different phosphatidylcholine bilayers with different main phase transition temperature (TM), namely, 1,2-dimyristoyl-sn-glycero-3-phosphocholine, 1,2-dipalmitoyl-sn-glycero-3-phosphocholine, and 2-dilauroyl-sn-glycero-3-phosphocholine. The solid-like phase shows a much higher Fy than the liquid-like phase, which also exhibits a jump in the force curve. Within the solid-like phase, Fy decreases as temperature is increased and suddenly drops as it approaches TM. Interestingly, a "well" in the Fy versus temperature plot occurs around TM, thus proving an "anomalous mechanical softening" around TM. Such mechanical softening has been predicted by experimental techniques and also by molecular dynamics simulations and interpreted in terms of water ordering around the phospholipid headgroups. Ion binding has been demonstrated to increase Fy, and its influence on both solid and liquid phases has also been discussed.


Figures

FIGURE 1
FIGURE 1
AFM contact mode images showing the phase transition for a DMPC-supported bilayer upon heating the sample (a) 19.0°C, (b) 24.4°C, (c) 27.2°C, (d) 28.3°C, (e) 29.3°C, (f) 30.3°C, (g) 31.3°C, (h) 32.9°C, and (i) 37.5°C. All images were acquired by applying a constant force of 1.5–2 nN.
FIGURE 2
FIGURE 2
DSC register obtained in a DMPC unilamellar liposome solution under the same high ionic strength solution used upon AFM images and force spectroscopy experiments (150 mM NaCl + 20 mM MgCl2, pH = 7.4). The plot shows a peak centered at 23.6°C corresponding to the lipid main phase transition. In contrast, 10 × 10 μm2 contact mode AFM images show the topography of the supported bilayer before (20.1°C), during (25°C), and after (36°C) the main phase transition. Although the main LβLα transition occurs within ∼3°C in solution, the temperature range broadens up to ∼14°C when supported in mica.
FIGURE 3
FIGURE 3
Force-distance curves obtained on a DMPC-supported lipid bilayer at different temperatures: (a) 20.1°C, (b) 29.5°C, (c) 40.9°C, and (d) 52.4°C. The discontinuity in the force-distance curve (breakthrough) indicates the tip penetration into the lipid bilayer, and the force at which it takes place is called yield threshold force. The dotted line highlights the overall breakthrough tendency as the temperature is increased.
FIGURE 4
FIGURE 4
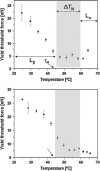
Yield threshold force dependence of a mica-supported DMPC bilayer with temperature for three independent experiments (different tip, different sample). All measurements were performed under high ionic strength solution. Each point in the graph corresponds to the center value of a Gaussian fitting to the obtained histogram. Error bars stand for standard deviation of the Gaussian fitting to the yield threshold force histograms. TM stands for the main transition temperature obtained from DSC measurements. Dark areas stand for the temperature range (ΔTM) in which phase transitions are observed in supported planar bilayers through AFM images (Fig. 1).
FIGURE 5
FIGURE 5
AFM contact mode images showing the main phase transition for a DPPC-supported bilayer upon heating the sample (a) 24.5°C, (b) 37.7°C, (c) 38.7°C, (d) 44.8°C, (e) 48.3°C, (f) 51.4°C, (g) 52.9°C, (h) 59.4°C, and cooling back to (i) 34.2°C.
FIGURE 6
FIGURE 6
Yield threshold force dependence of a mica-supported DPPC bilayer with temperature for two independent experiments (different tip, different sample). All measurements were performed under high ionic strength solution. Each point in the graph corresponds to the center value of a Gaussian fitting to the obtained histogram. Error bars stand for standard deviation of the Gaussian fitting to the yield threshold force histograms. TM stands for the main transition temperature obtained from DSC measurements. Dark areas stand for the temperature range (ΔTM) in which phase transitions are observed in supported planar bilayers through AFM images (Fig. 5).
FIGURE 7
FIGURE 7
(a) 5 × 5 μm2 contact mode AFM image of DLPC-supported bilayer showing total surface coverage. Force plots were performed in different positions all around the surface, yielding force-distance curves such as that observed in b, where the discontinuity in the curve is shown (yield threshold point). (c and d) Yield threshold force dependence of a mica-supported DLPC bilayer with temperature for two independent experiments (different tip, different sample). Each point in the graph corresponds to the center value of a Gaussian fitting to the obtained histogram. Error bars stand for standard deviation of the Gaussian fitting to the yield threshold force histograms. All measurements are performed in the liquid-like phase, since TM (−1°C) is far below the sampled temperatures.
FIGURE 8
FIGURE 8
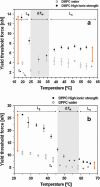
Yield threshold force dependence with temperature of a mica-supported (a) DMPC bilayer and (b) DPPC bilayer formed and measured in buffered distilled water (white circles) and in buffered high ionic strength solution (black circles). In both cases both curves exhibit a well around the surface transition temperature ΔTM (darker region), and the bilayer measured under high ionic strength conditions is shifted to higher yield force values, thus suggesting a higher stiffness, both in the solid-like and in the liquid-like phases. The difference in the yield threshold force is enhanced in the solid-state phase (left arrows) with respect to the liquid-like phase (right arrows). Both curves (under high ionic strength and distilled water) for DMPC and DPPC were performed with the same tip (kc = 0.08 N/m for DMPC and kc = 0.5 N/m for DPPC).

References

    1. Garcia-Manyes, S., G. Oncins, and F. Sanz. 2005. Effect of ion-binding and chemical phospholipid structure on the nanomechanics of lipid bilayers studied by force spectroscopy. Biophys. J. 89:1812–1826. - PMC - PubMed
    1. Nagle, J. F., and S. Tristram-Nagle. 2000. Structure of lipid bilayers. Biochim. Biophys. Acta. 1469:159–195. - PMC - PubMed
    1. Nagle, J. F., H. I. Petrache, N. Gouliaev, S. Tristram-Nagle, Y. F. Liu, R. M. Suter, and K. Gawrisch. 1998. Multiple mechanisms for critical behavior in the biologically relevant phase of lecithin bilayers. Phys. Rev. 58:7769–7776.
    1. Makino, K., T. Yamada, M. Kimura, T. Oka, H. Ohshima, and T. Kondo. 1991. Temperature- and ionic strength-induced conformational changes in the lipid head group region of liposomes as suggested by zeta potential data. Biophys. Chem. 41:175–183. - PubMed
    1. Wu, S. H. W., and H. M. McConnel. 1973. Lateral phase separations and perpendicular transport in membranes. Biochem. Biophys. Res. Commun. 55:484–491. - PubMed

Publication types

Substances

LinkOut - more resources