

Differential regulation of MUC5AC/Muc5ac and hCLCA-1/mGob-5 expression in airway epithelium
- PMID: 16151054
- PMCID: PMC2715330
- DOI: 10.1165/rcmb.2004-0220RC
Differential regulation of MUC5AC/Muc5ac and hCLCA-1/mGob-5 expression in airway epithelium
Abstract
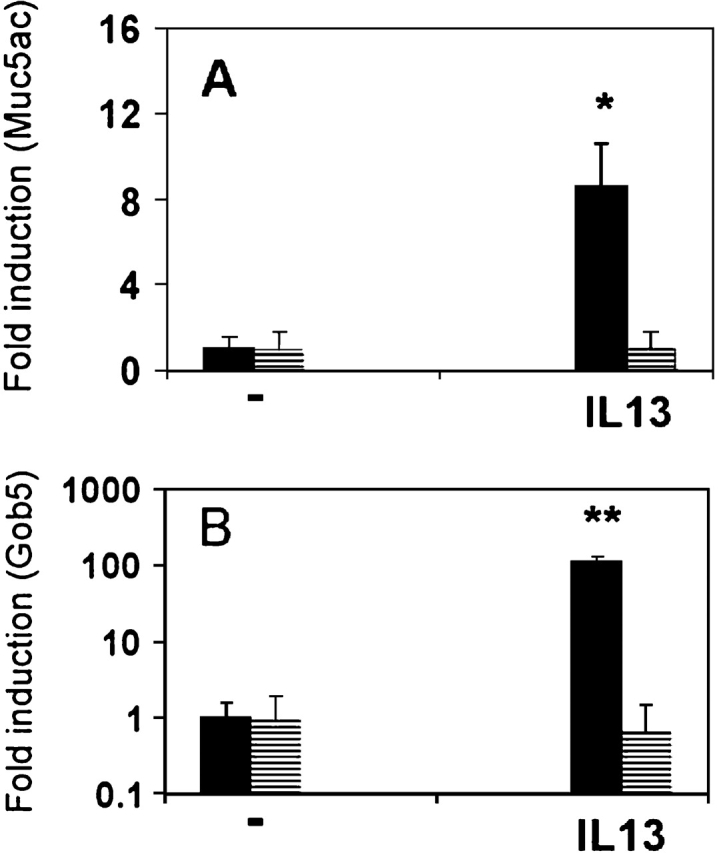
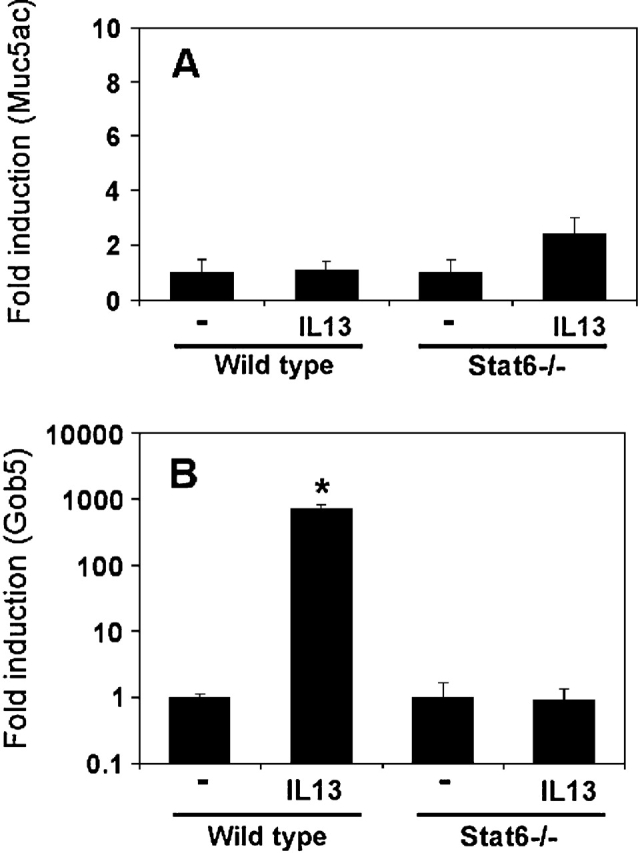
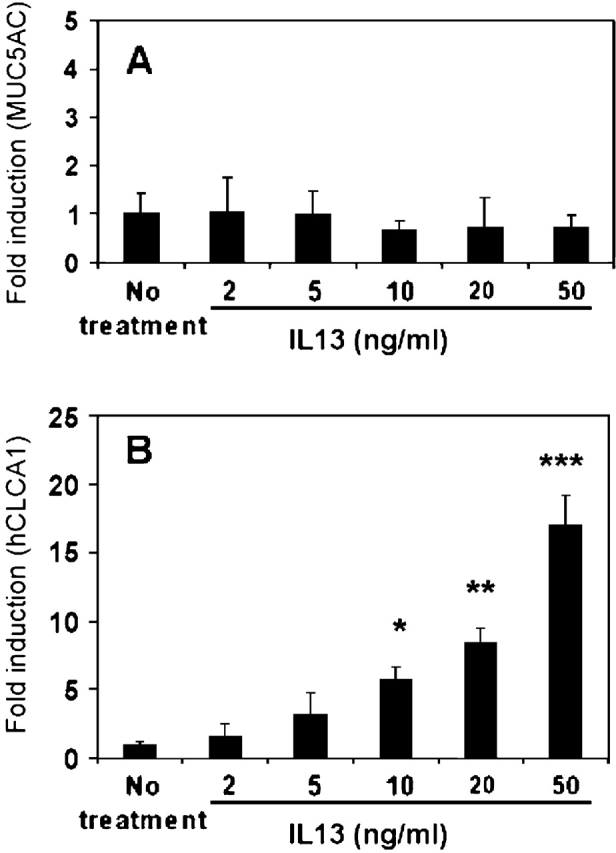
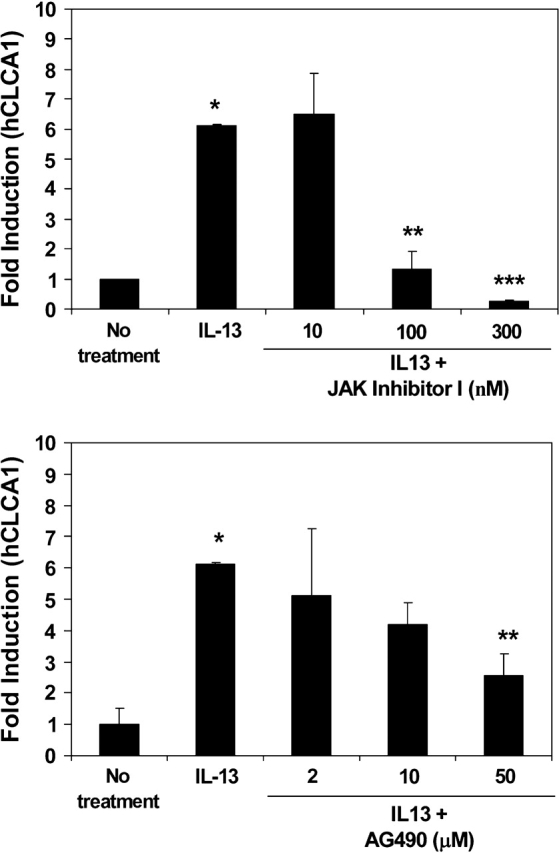
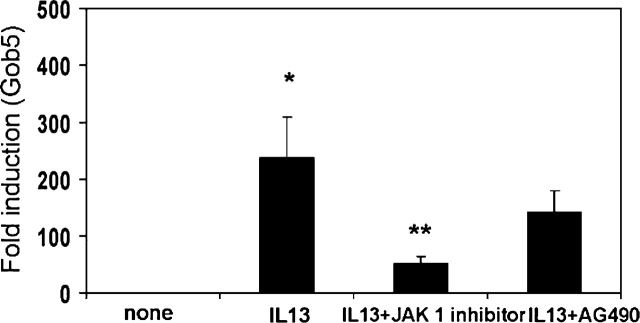
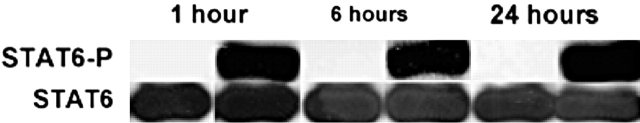
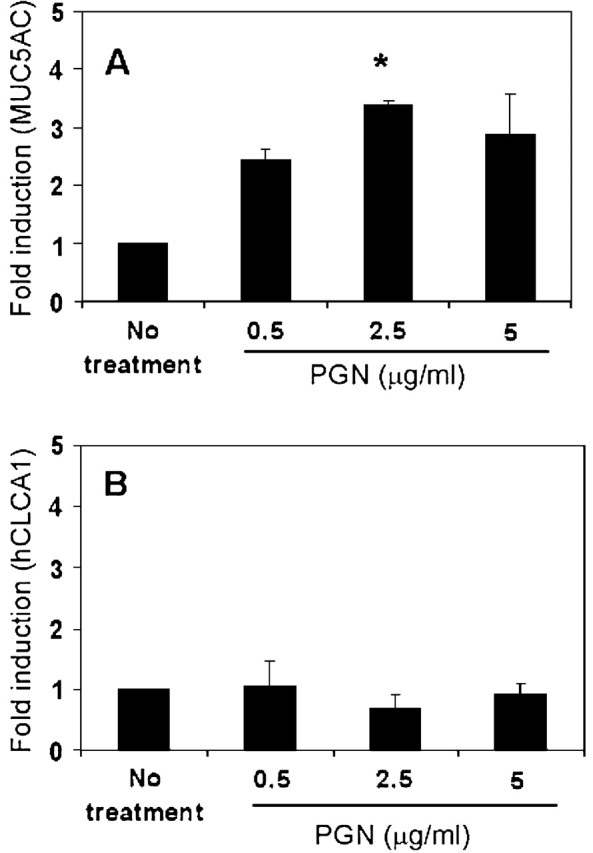
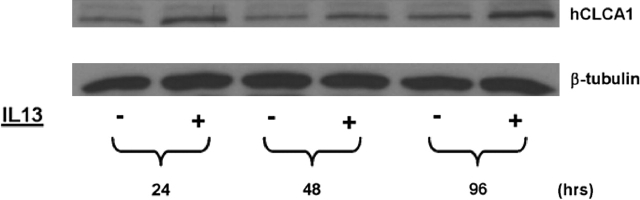
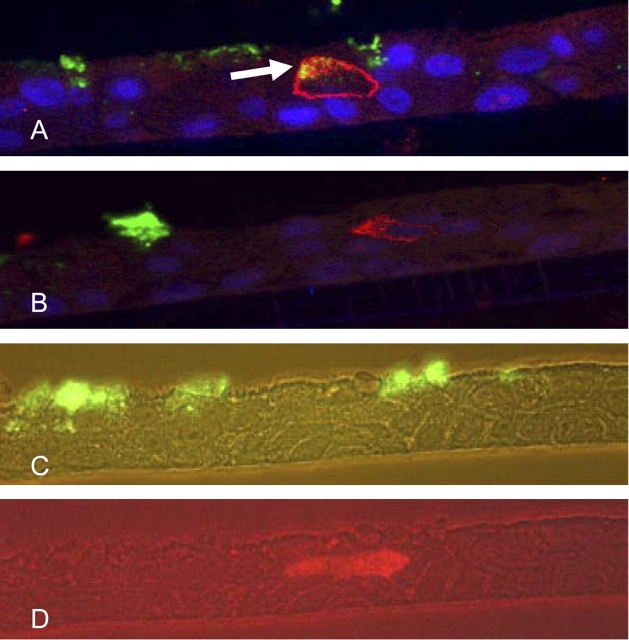
This study demonstrates that the two biomarkers, MUC5AC/ Muc5ac and hCLCA1/Gob5, which are frequently associated with surface mucous/goblet cells in asthmatic airways, are differentially regulated. Intratracheal instillation of IL-13 (0.5 mug/mouse lung) elicited 8- and 110-fold induction of Muc5ac and Gob5 messages, respectively, within 24 h in wild-type mouse lung, whereas these inductions were abrogated in Stat6 knockout mice. The induction of MUC5AC/Muc5ac message could not be duplicated in vitro with primary tracheobronchial epithelial (TBE) cells derived from wild-type mice or humans, despite significant inductions still seen for hCLCA1/Gob5. Further studies with JAK inhibitors and STAT6 signaling showed active signaling of the JAK/STAT6 pathway in these primary TBE cultures by IL-13 in the regulation of hCLCA1 expression. Dual immunofluorescent staining with antibodies specific to MUC5AC and hCLCA1 revealed a differential nature of the expression of these two biomarkers by distinct cell types of primary TBE cultures. Finally, MUC5AC expression could be elevated by a bacterial product, peptidoglycan, without any induction of hCLCA1. Thus, these results suggest that the two biomakers of the metaplastic airway mucous cell type are differentially regulated by JAK/STAT6-dependent and -independent pathways.
Figures
Similar articles
-
Niflumic acid suppresses interleukin-13-induced asthma phenotypes.Am J Respir Crit Care Med. 2006 Jun 1;173(11):1216-21. doi: 10.1164/rccm.200410-1420OC. Epub 2006 Mar 9. Am J Respir Crit Care Med. 2006. PMID: 16528019
-
Involvement of the p38 MAPK pathway in IL-13-induced mucous cell metaplasia in mouse tracheal epithelial cells.Respirology. 2008 Mar;13(2):191-202. doi: 10.1111/j.1440-1843.2008.01237.x. Respirology. 2008. PMID: 18339016
-
Relationship between calcium-activated chloride channel 1 and MUC5AC in goblet cell hyperplasia induced by interleukin-13 in human bronchial epithelial cells.Respiration. 2006;73(3):347-59. doi: 10.1159/000091391. Epub 2006 Feb 6. Respiration. 2006. PMID: 16465045
-
Regulation of mucous differentiation and mucin gene expression in the tracheobronchial epithelium.Toxicology. 2001 Mar 7;160(1-3):35-46. doi: 10.1016/s0300-483x(00)00455-8. Toxicology. 2001. PMID: 11246122
-
Mucins and Their Roles in Asthma.Immunol Rev. 2025 May;331(1):e70034. doi: 10.1111/imr.70034. Immunol Rev. 2025. PMID: 40305069 Review.
Cited by
-
Pyocyanin-induced mucin production is associated with redox modification of FOXA2.Respir Res. 2013 Aug 5;14(1):82. doi: 10.1186/1465-9921-14-82. Respir Res. 2013. PMID: 23915402 Free PMC article.
-
Physiology and pathophysiology of human airway mucus.Physiol Rev. 2022 Oct 1;102(4):1757-1836. doi: 10.1152/physrev.00004.2021. Epub 2022 Jan 10. Physiol Rev. 2022. PMID: 35001665 Free PMC article. Review.
-
Peptidoglycan from Staphylococcus aureus increases MUC5AC gene expression via RSK1-CREB pathway in human airway epithelial cells.Mol Cells. 2011 Oct;32(4):359-65. doi: 10.1007/s10059-011-0118-3. Epub 2011 Sep 6. Mol Cells. 2011. PMID: 21904880 Free PMC article.
-
Biosignature for airway inflammation in a house dust mite-challenged murine model of allergic asthma.Biol Open. 2016 Jan 6;5(2):112-21. doi: 10.1242/bio.014464. Biol Open. 2016. PMID: 26740570 Free PMC article.
-
MicroRNA regulation of type 2 innate lymphoid cell homeostasis and function in allergic inflammation.J Exp Med. 2017 Dec 4;214(12):3627-3643. doi: 10.1084/jem.20170545. Epub 2017 Nov 9. J Exp Med. 2017. PMID: 29122948 Free PMC article.
References
-
- Jeffery PK. Remodeling in asthma and chronic obstructive lung disease. Am J Respir Crit Care Med 2001;164(Suppl. 10 Pt 2):S28–S38. - PubMed
-
- Puchelle E, Bajolet O, Abely M. Airway mucus in cystic fibrosis. Paediatr Respir Rev 2002;3:115–119. - PubMed
-
- Voynow JA. What does mucin have to do with lung disease? Paediatr Respir Rev 2002;3:98–103. - PubMed
-
- Rogers DF. Airway goblet cells: responsive and adaptable front-line defenders. Eur Respir J 1994;7:1690–1706. - PubMed
Publication types
MeSH terms
Substances
Grants and funding
LinkOut - more resources
Full Text Sources
Molecular Biology Databases
Research Materials
Miscellaneous
