Outcome of periacetabular osteotomy: joint contact pressure calculation using standing AP radiographs, 12 patients followed for average 2 years
- PMID: 16156455
- PMCID: PMC2745131
Outcome of periacetabular osteotomy: joint contact pressure calculation using standing AP radiographs, 12 patients followed for average 2 years
Abstract
Background: Due to wide variations in acetabular structure of individuals with hip dysplasia, the measurement of the acetabular orientation may not be sufficient to predict the joint loading and pressure distribution across the joint. Addition of mechanical analysis to preoperative planning, therefore, has the potential to improve the clinical outcome. We analyzed the effect of periacetabular osteotomy on hip dysplasia using computer-aided simulation of joint contact pressure on regular AP radiographs. The results were compared with the results of surgery based on realignment of acetabular angles to the normal hip.
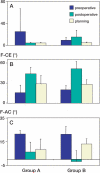
Patients and methods: We studied 12 consecutive periacetabular osteotomies with no femoral head deformity. The median age of patients, all females, was 35 (20-50) years. The median follow-up was 2 years (1.3-2.2). Patient outcome was measured with the total score of a self-administered questionnaire (q-score) and with the Harris hip score. The pre- and postoperative orientation of the acetabulum was defined using reconstructed 3D CT-slices to measure angles in the three anatomical planes. Peak contact pressure, weight-bearing area, and the centroid of the contact pressure distribution (CP-ratio) were calculated.
Results: While 9 of 12 cases showed decreased peak pressure after surgery, the mean changes in weight-bearing area and peak contact pressure were not statistically significant. However, CP-ratio changed (p < 0.001, paired t-test) with surgery. For the optimal range of CP-ratio (within its mid-range 40-60%), the mechanical outcome improved significantly.
Interpretation: Verifying the correlation between the optimal CP-ratio and the outcome of the surgery requires additional studies on more patients. Moreover, the anatomically measured angles were not correlated with the ranges of CP-ratio, suggesting that they do not always associate with objective mechanical goals of realignment osteotomy. Mechanical analysis, therefore, can be a valuable tool in assessing two-dimensional radiographs in hip dysplasia.
Figures


Similar articles
-
Is Anterior Rotation of the Acetabulum Necessary to Normalize Joint Contact Pressure in Periacetabular Osteotomy? A Finite-element Analysis Study.Clin Orthop Relat Res. 2022 Jan 1;480(1):67-78. doi: 10.1097/CORR.0000000000001893. Clin Orthop Relat Res. 2022. PMID: 34228657 Free PMC article.
-
Does Patient-specific Functional Pelvic Tilt Affect Joint Contact Pressure in Hip Dysplasia? A Finite-element Analysis Study.Clin Orthop Relat Res. 2021 Aug 1;479(8):1712-1724. doi: 10.1097/CORR.0000000000001737. Clin Orthop Relat Res. 2021. PMID: 33787527 Free PMC article.
-
Patient Age and Hip Morphology Alter Joint Mechanics in Computational Models of Patients With Hip Dysplasia.Clin Orthop Relat Res. 2019 May;477(5):1235-1245. doi: 10.1097/CORR.0000000000000621. Clin Orthop Relat Res. 2019. PMID: 30801275 Free PMC article.
-
Rotational Acetabular Osteotomy for Pre- and Early Osteoarthritis Secondary to Dysplasia Provides Durable Results at 20 Years.Clin Orthop Relat Res. 2016 Oct;474(10):2145-53. doi: 10.1007/s11999-016-4854-8. Clin Orthop Relat Res. 2016. PMID: 27121873 Free PMC article.
-
Periacetabular osteotomy in the treatment of severe acetabular dysplasia. Surgical technique.J Bone Joint Surg Am. 2006 Mar;88 Suppl 1 Pt 1:65-83. doi: 10.2106/JBJS.E.00887. J Bone Joint Surg Am. 2006. PMID: 16510801 Review.
Cited by
-
Providing a computationally derived, mechanically optimised target correction during preoperative planning can improve joint contact mechanics of hip dysplasia treated with periacetabular osteotomy.Hip Int. 2024 May;34(3):378-389. doi: 10.1177/11207000231212403. Epub 2023 Dec 10. Hip Int. 2024. PMID: 38073284 Free PMC article.
-
Factors predicting the failure of Bernese periacetabular osteotomy: a meta-regression analysis.Int Orthop. 2009 Dec;33(6):1483-8. doi: 10.1007/s00264-008-0643-7. Epub 2008 Aug 22. Int Orthop. 2009. PMID: 18719916 Free PMC article.
-
The 'low-volume acetabulum': dysplasia in disguise.J Hip Preserv Surg. 2018 Oct 16;5(4):399-403. doi: 10.1093/jhps/hny036. eCollection 2018 Dec. J Hip Preserv Surg. 2018. PMID: 30647931 Free PMC article.
-
Role of the acetabular labrum in load support across the hip joint.J Biomech. 2011 Aug 11;44(12):2201-6. doi: 10.1016/j.jbiomech.2011.06.011. Epub 2011 Jul 14. J Biomech. 2011. PMID: 21757198 Free PMC article.
-
A Single Approach to Arthroscopic Reduction and Debridement for Developmental Dislocation of the Hip in 12 Infants.Med Sci Monit. 2019 Nov 21;25:8807-8813. doi: 10.12659/MSM.916434. Med Sci Monit. 2019. PMID: 31749446 Free PMC article.
References
-
- An KN, Himeno S, Tsumura T, Chao EYC. Pressure distribution on articular surfaces: application of joint stability evaluation. J Biomech. 1990;23(10):1013–20. - PubMed
-
- Armand M, Merkle A, Sukal T, Kleinberger M. Experimental evaluation of a model of contact pressure distribution in the hip joint.. Proceedings of World Congress on Biomechanics; Calgary, Alberta. Aug, 2002.
-
- Bombelli R. Radiological pattern of the normal hip joint and its biomechanical meaning. In: Draenert K, Rütt, editors. Grundlagen zur Morphologie und Function der Hüfte. Vol. 1. Histo-Morph Bewegungsapp München: Art and Science; 1981. pp. 113–38.
-
- Brent RP. Algorithms for minimization without derivatives. Prentice-Hall, Englewood Cliffs, New Jersey: 1973. Chapter 5.
-
- Elias JJ, Wilson DR, Adamson R, Cosgarea AJ. Evaluation of a computational model used to predict the patellofemoral contact pressure distribution. J Biomech. 2004;37(3):295–302. - PubMed
Publication types
MeSH terms
Grants and funding
LinkOut - more resources
Full Text Sources
Medical
Miscellaneous
