. 2005 Sep 19;202(6):817-28.
doi: 10.1084/jem.20051106. Epub 2005 Sep 12.

Chloroquine enhances human CD8+ T cell responses against soluble antigens in vivo

Affiliations

Chloroquine enhances human CD8+ T cell responses against soluble antigens in vivo

Daniele Accapezzato et al. J Exp Med. .

Abstract

The presentation of exogenous protein antigens in a major histocompatibility complex class I-restricted fashion to CD8+ T cells is called cross-presentation. We demonstrate that cross-presentation of soluble viral antigens (derived from hepatitis C virus [HCV], hepatitis B virus [HBV], or human immunodeficiency virus) to specific CD8+ T cell clones is dramatically improved when antigen-presenting dendritic cells (DCs) are pulsed with the antigen in the presence of chloroquine or ammonium chloride, which reduce acidification of the endocytic system. The export of soluble antigen into the cytosol is considerably higher in chloroquine-treated than in untreated DCs, as detected by confocal microscopy of cultured cells and Western blot analysis comparing endocytic and cytosolic fractions. To pursue our findings in an in vivo setting, we boosted groups of HBV vaccine responder individuals with a further dose of hepatitis B envelope protein vaccine with or without a single dose of chloroquine. Although all individuals showed a boost in antibody titers to HBV, six of nine individuals who were administered chloroquine showed a substantial CD8+ T cell response to HBV antigen, whereas zero of eight without chloroquine lacked a CD8 response. Our results suggest that chloroquine treatment improves CD8 immunity during vaccination.


Figures
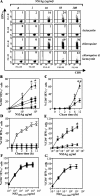
Figure 1.
Figure 1.
Cross-presentation efficiency is dependent on the inhibition of antigen degradation. (A) FC analysis of an HLA-A2– restricted NS31406–1415-specific CD8+ T cell clone producing IFN-γ in response to NS3Ag cross-presented by HLA-A2+ iDCs, in the presence or absence of the indicated compounds. Dot plots show double CD8 and IFN-γ staining. Results are expressed as percentages of cells and are indicated in each quadrant. One representative out of six different experiments is shown. (B) NS3Ag cross-presentation after 12 h of pulsing by six independent HLA-A2+ iDC populations to an NS31406–1415-specific CD8 clone (mean ± SD), in the absence (diamonds) or presence of chloroquine (triangles), leupeptin (squares), or lactacystin (circles). *, P < 0.0001 in the presence versus absence of chloroquine. (C) Chase time of 50 μg/ml NS3Ag cross-presentation after 30 min of pulsing by six independent iDC populations (mean ± SD), in the presence (triangles) or absence (diamonds) of chloroquine. *, P = 0.001 and **, P < 0.0001 in the presence versus absence of chloroquine. (D) NS3Ag (closed diamonds), NS3Ag + chloroquine (triangles), or peptide (open diamonds) presentation by three independent HLA-A2+ EBV–B cells to an NS31406–1415-specific CD8 clone (mean ± SD). (E) Presentation of NS3Ag (*, P < 0.0001 in the presence versus absence of chloroquine) by four independent DC populations to an NS31241–1260-specific CD4 T cell clone (mean ± SD), in the presence (triangles) or absence (diamonds) of chloroquine. (F and G) Presentation of the indicated peptides to the NS31406–1415- specific CD8 clone (F) or the NS31241–1260-specific CD4 T cell clone (G) in the absence (diamonds) or presence of chloroquine (triangles) or lactacystin (circles).
Figure 2.
Figure 2.
Efficient direct presentation of endogenous NS3Ag. FC analysis of 2 × 10⁴ HLA-A2+ NS31406–1415-specific CD8+ T cell clones producing IFN-γ in response to endogenous NS3Ag directly presented by 2 × 10⁴ autologous EBV–B cells that had been infected by either 5 PFU/cell of WT VV or NS3Ag-expressing VV (VV-NS3), in the presence or absence of lactacystin (lacta.) or chloroquine (chlor.). Dot plots show IFN-γ staining. Results are expressed as percentages of cells and are indicated in each quadrant. One representative out of three different experiments is shown. SSC, side scatter.
Figure 3.
Figure 3.
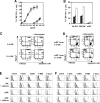
Cross-presentation and its improvement are restricted to iDCs. (A) IFN-γ production by an HLA-A2–restricted NS31406–1415- specific CD8 T cell clone in response to either four independent HLA-A2+ early (day 5; closed circles and triangles) or late (day 11; open circles and triangles) iDC populations cross-presenting either NS3Ag (triangles) or peptide (circles). Values represent mean ± SD. (B) IFN-γ production by an NS31406–1415-specific CD8 T cell clone in response to four independent HLA-A2+ 5-d iDCs, 10-d iDCs, or mDCs, which had been unpulsed (dotted bars) or pulsed with 50 μg/ml NS3Ag alone (closed bars), in the presence of leupeptin (hatched bars) or chloroquine (open bars). Values represent mean ± SD. (C and D) Capacity of PKH67 (green)-dyed 5-d iDCs, PKH67 (green)-dyed 11-d iDCs (C), or PKH67 (green)-dyed mDCs (derived from either 5- or 11-d iDCs; panel D) to phagocytose PKH26 (red)-apoptotic cells as detected by FC. Phagocytosis was assessed as DCs double positive for apoptotic cells. The numbers of cells in C and D were similar. One representative out of three different experiments is shown. (E and F) Surface phenotype analysis of 5-d iDCs, mDCs derived from 5-d iDCs (E), 11-d iDCs, or mDCs derived from 11-d iDCs (F), in the presence or absence of chloroquine. Shaded histograms represent the isotype-matched control mAbs; open histograms represent stainings with mAbs specific to the surface molecules indicated in the figure. One representative out of three different experiments is shown.
Figure 4.
Figure 4.
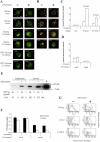
Improvement of soluble antigen export from endosomes into cytosol in chloroquine-treated iDCs. (A and B) iDCs were pulsed/chased with either NS3Ag alone or NS3Ag and TRITC-Tf, in the presence or absence of chloroquine, fixed, and stained at different times with human anti-NS3 alone or with anti-NS3 + rabbit anti–cathepsin D (C and D), followed by staining with the appropriate secondary antibodies. The signal of NS3 alone is green. The signals of double staining of Tf or CD and NS3 are red and green, respectively. The extent of colocalization is shown in yellow after merging. Arrows indicate NS3 enrichment or colocalization with Tf or CD. In control experiments, DCs were incubated for 1 h at 37°C in the presence of 1 mg/ml FITC-dextran with the indicated molecular masses and then fixed. One representative out of three different experiments is shown. (C) Quantitative analysis of the fluorescence intensity of cytosolic NS3Ag in iDCs pulsed/chased with NS3Ag in the presence or absence of chloroquine. (D) Quantitative analysis of the fluorescence intensity of cytosolic FITC-dextran in iDCs pulsed/chased with FITC-dextran of the indicated molecular masses, in the presence or absence of chloroquine. (E) One representative out of three WB analyses on both endocytic- and cytosol-enriched preparations, purified from iDCs, which had been previously pulsed/chased (20′/90′) with the indicated concentrations of NS3Ag, in the presence or absence of chloroquine. The two preparations were then separated by SDS-PAGE and immunoblotted for NS3Ag with the relevant human mAb and a secondary peroxidase-conjugated goat anti–human IgG antibody. NS3Ag alone (↓) was used as positive control. (F) Fluorometric analyses of different FITC-dextrans in endocytic or cytosolic fractions from iDCs pulsed with the indicated FITC-dextrans in the presence or absence of chloroquine. (G) One representative kinetic out of four detected by FC of NS3Ag, TAP-2, or LAMP-2 staining in phagosomes containing a mixture of soluble NS3Ag and LB. Analyses were performed on gated phagosomes containing LB. Isotype control, green; staining after 20′ of pulsing, red; staining after 20' of pulsing + 90′ of chase, blue.
Figure 5.
Figure 5.
Chloroquine-boosted cross-presentation elicits antigen-specific CD8+ T cells ex vivo. (A and B) Double CD4 and CD8 FC staining in PBMCs from one representative HLA-A2+ HCV-infected individual out of three studied on 15-d stimulation with NS3Ag in the presence (A) or absence (B) of chloroquine. PBMCs were then restimulated (6 h) with autologous DCs, which had been pulsed or not as indicated, and tested for IFN-γ production. The NS31406–1415 peptide was used for detecting the CD8 cell-dependent IFN-γ production, whereas the NS31241–1260 peptide was used for detecting the CD4 cell-dependent IFN-γ production. (C and D) Double CD4 and CD8 FC staining in PBMCs from one representative HIV-infected individual out of three studied on 15-d stimulation with 50 μg/ml Nef in the presence (C) or absence (D) of chloroquine. Cells were then restimulated with autologous iDCs, which had been pulsed or not as indicated, and tested for IFN-γ production. Dot plots are gated on CD8 or CD4 cells and show IFN-γ staining. Results are expressed as percentages of IFN-γ+ cells and are indicated in each quadrant.
Figure 6.
Figure 6.
Chloroquine-boosted cross-presentation elicits antigen-specific CD8+ T cells in vivo. ELISPOT assays on fresh CD8+ T cells isolated from PBMCs of high responders to HBV vaccine, performed before (A) and after (B) chloroquine treatment and anti-HBV vaccine boost, or before (C) and after (D) only the anti-HBV vaccine boost. Fresh CD8+ T cells were tested for their capacity to form IFN-γ spots within 6 h of contact with autologous irradiated APCs, which had been previously pulsed or not with entire HBenvAg plus chloroquine or HLA-A2–binding HBenvAg213–221 peptide, in the presence or absence of blocking anti-HLA–A,B,C mAb or the corresponding isotype antibody, as indicated in A. Results are expressed as spot-forming cells (SFC) in 2 × 10⁵ CD8+ T cells. The SFC values were subtracted by background, which was below 10 SFC in 2 × 10⁵ cells in each test. SFC values obtained in response to the entire HBenvAg were significantly higher in chloroquine-treated than in untreated high responders (P < 0.001), as well as those obtained in response to the HLA-A2–binder HBenvAg peptide (P < 0.05) calculated among the HLA-A2+ high responders. The numbers with asterisks represent HLA-A2+ individuals. Histograms, attached to the right of each panel, report serum anti-HBenvAg (anti-HBs) antibody levels determined before and after the anti-HBV vaccination boost in all individuals studied (either chloroquine-treated or untreated).

References

    1. Rock, K.L. 1996. A new foreign policy: MHC class I molecules monitor the outside world. Immunol. Today. 17:131–137. - PubMed
    1. Crowley, M., K. Inaba, and R.M. Steinman. 1990. Dendritic cells are the principal cells in mouse spleen bearing immunogenic fragments of foreign proteins. J. Exp. Med. 172:383–386. - PMC - PubMed
    1. Kovacsovics-Bankowski, M., K. Clark, B. Benacerraf, and K.L. Rock. 1993. Efficient major histocompatibility complex class I presentation of exogenous antigen upon phagocytosis by macrophages. Proc. Natl. Acad. Sci. USA. 90:4942–4946. - PMC - PubMed
    1. Pfeifer, J.D., M.J. Wick, R.L. Roberts, K. Findlay, S.J. Normark, and C.V. Harding. 1993. Phagocytic processing of bacterial antigens for class I MHC presentation to T cells. Nature. 361:359–362. - PubMed
    1. Norbury, C.C., L.J. Hewlett, A.R. Prescott, N. Shastri, and C. Watts. 1995. Class I MHC presentation of exogenous soluble antigen via macropinocytosis in bone marrow macrophages. Immunity. 3:783–791. - PubMed

Publication types

MeSH terms