. 2005 Sep 12;170(6):959-69.
doi: 10.1083/jcb.200506042.

Syntabulin-mediated anterograde transport of mitochondria along neuronal processes

Affiliations

Syntabulin-mediated anterograde transport of mitochondria along neuronal processes

Qian Cai et al. J Cell Biol. .

Abstract

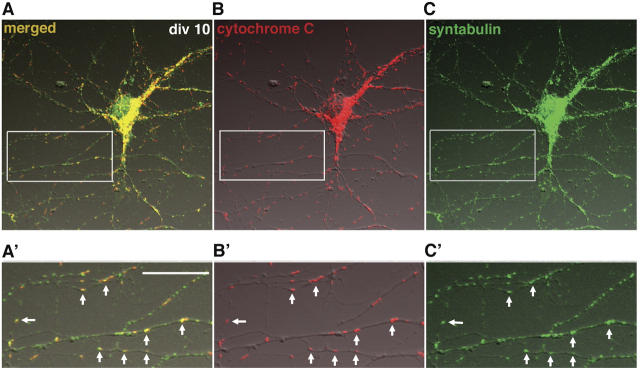
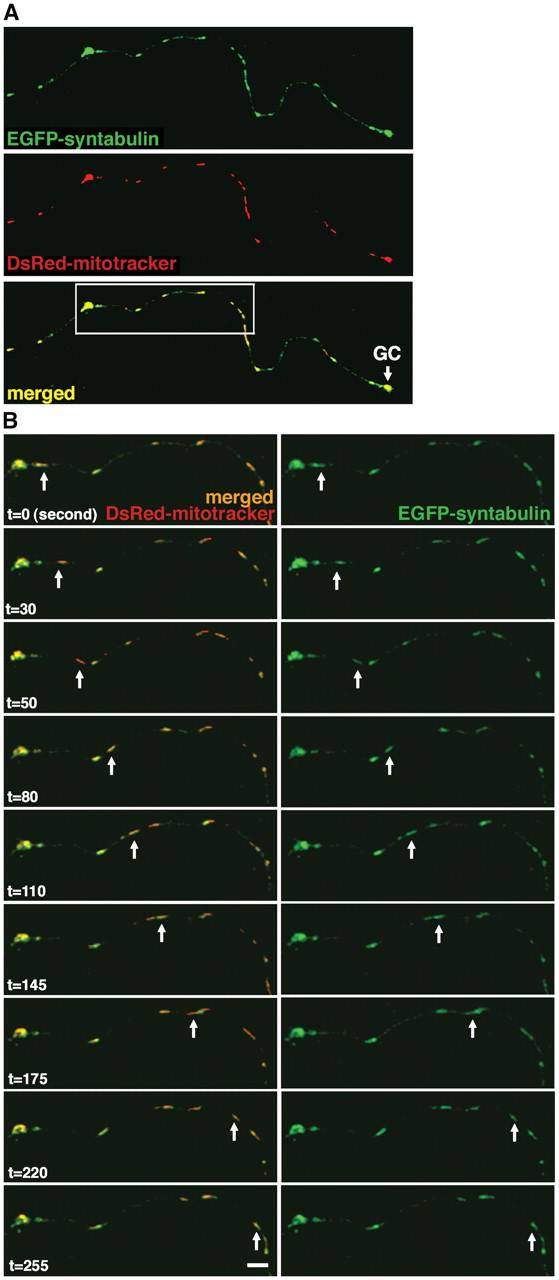
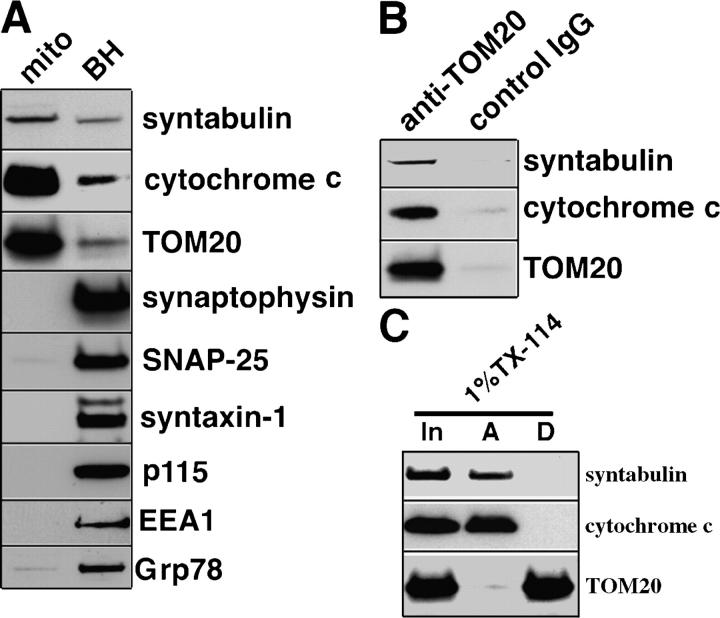
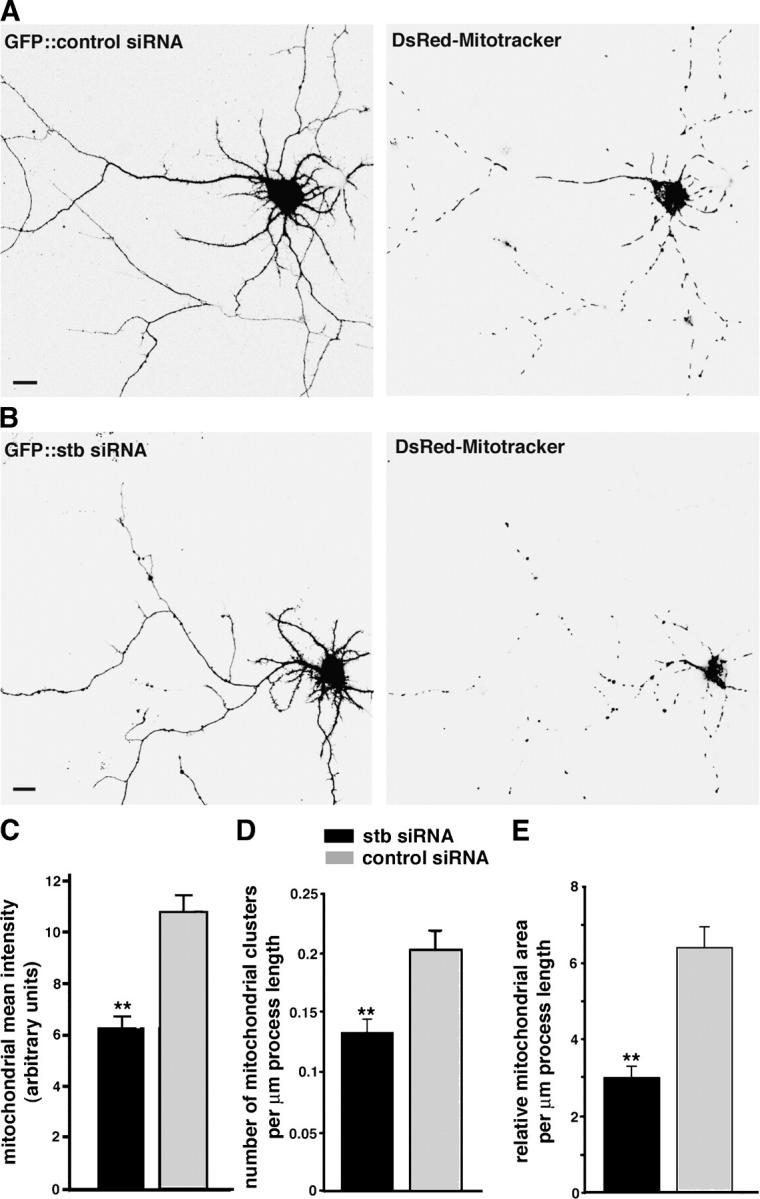
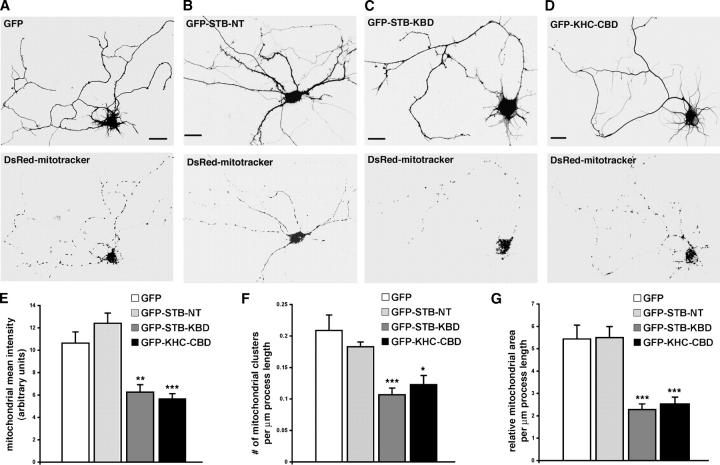
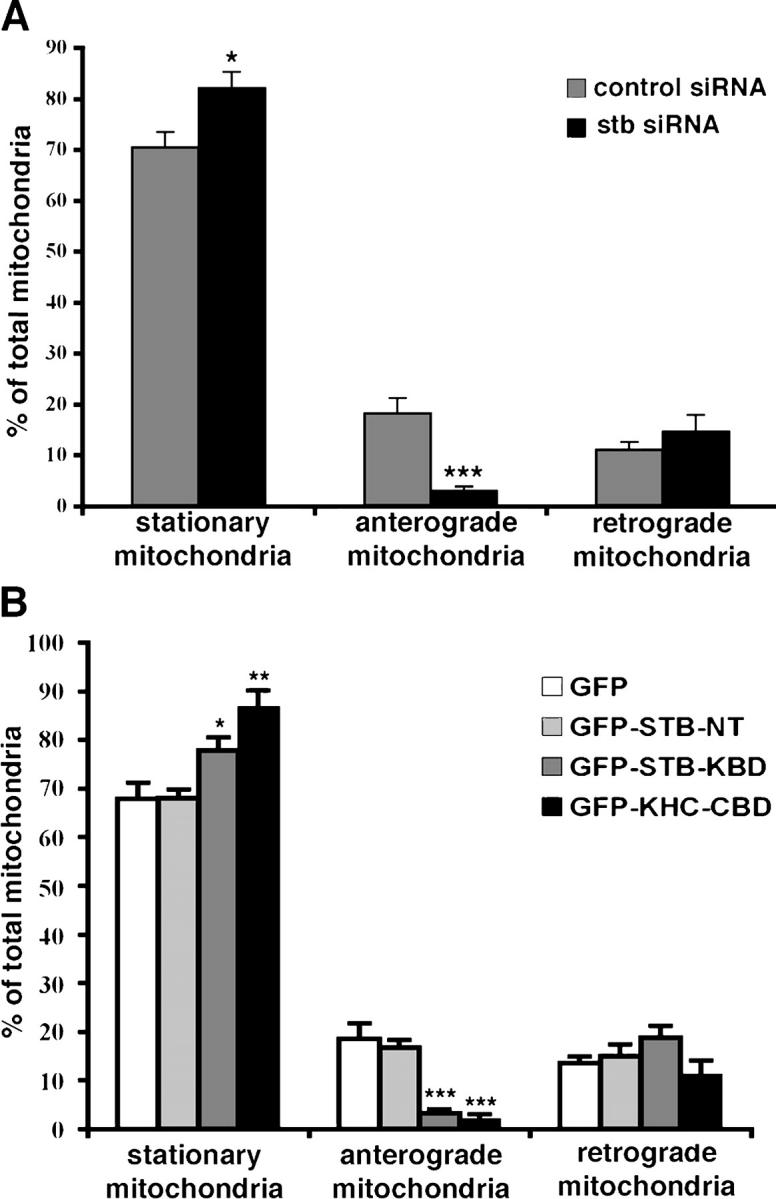
In neurons, proper distribution of mitochondria in axons and at synapses is critical for neurotransmission, synaptic plasticity, and axonal outgrowth. However, mechanisms underlying mitochondrial trafficking throughout the long neuronal processes have remained elusive. Here, we report that syntabulin plays a critical role in mitochondrial trafficking in neurons. Syntabulin is a peripheral membrane-associated protein that targets to mitochondria through its carboxyl-terminal tail. Using real-time imaging in living cultured neurons, we demonstrate that a significant fraction of syntabulin colocalizes and co-migrates with mitochondria along neuronal processes. Knockdown of syntabulin expression with targeted small interfering RNA or interference with the syntabulin-kinesin-1 heavy chain interaction reduces mitochondrial density within axonal processes by impairing anterograde movement of mitochondria. These findings collectively suggest that syntabulin acts as a linker molecule that is capable of attaching mitochondrial organelles to the microtubule-based motor kinesin-1, and in turn, contributes to anterograde trafficking of mitochondria to neuronal processes.


Figures

Figure 1.
Figure 1.
Endogenous syntabulin colocalizes with mitochondria in the somata and processes of cultured hippocampal neurons. (A–C) Low-density hippocampal cultures at DIV10 were coimmunostained with affinity-purified antibodies against mitochondrial marker cytochrome c (red, B) and syntabulin (green, C). (A) The image is shown in a merged differential interference contrast. (A′–C′) Close-up of the boxed region from A–C. Syntabulin staining appeared as elongated vesicular-tubular structures and many of these colocalized with mitochondria in neuronal somata and neuritic processes (white arrows). Bar in (A), 10 μm.
Figure 2.
Figure 2.
Syntabulin and mitochondria co-migrate along neuronal processes. (A) Full-length STB partially colocalizes with mitochondria along axonal process and within the growth cone (GC). Cultured hippocampal neurons (DIV6) were cotransfected with EGFP-STB (green) and DsRed-mitotracker (DsRed2-tagged mitochondrial targeting sequence of cytochrome c oxidase, red), and the selected axonal process was imaged. (B) STB-associated mitochondria move along the axonal processes. The selected axonal process (white box in panel A) from a live hippocampal neuron was examined by time-lapse imaging 18 h after transfection. The arrows point to a moving mitochondrion associated with EGFP-STB, which migrated anterogradely along the axon toward the growth cone at an average velocity of ∼0.3–0.4 μm s−1. Images were collected every 5 s. Bar in (B), 10 μm.
Figure 3.
Figure 3.
Syntabulin is a peripheral membrane-associated protein of mitochondria. (A) Syntabulin is enriched in the mitochondrial fraction. Neuronal mitochondria fraction (mito) was prepared with Percoll-gradient centrifugation from rat forebrain. The relative enrichment of mitochondria was compared with equal total protein (20 μg/lane) of brain homogenates (BH) by detecting cytochrome c (the mitochondrial protein resident in the intermembrane space) and TOM20 (the mitochondrial outer membrane protein). Relative purity of the mitochondrial fraction was assessed by sequential immunoblotting of nonmitochondrial markers, including synaptophysin (synaptic vesicles), SNAP-25 and syntaxin-1 (synaptic plasma membrane), p115 (Golgi), EEA1 (endosomes), and Grp78 (ER). (B) Immunoisolation of mitochondrial organelles. The mitochondrial fraction was incubated with magnetic beads that were coated with the antibody against TOM20, a mitochondrial outer membrane protein, or normal IgG control. The beads-bound fractions were subjected to immunoblotting. (C) Syntabulin is a membrane peripheral protein of mitochondria. Mitochondria-enriched fraction was subjected to Triton X-114 (TX-114) phase partitioning. In: input of the starting material; A and D: the aqueous or detergent phase of Triton X-114 phase partitioning, respectively.
Figure 4.
Figure 4.
Knockdown of syntabulin reduces mitochondrial density in the neuronal processes of cultured hippocampal neurons. (A, B) Hippocampal neurons (DIV4 or 5) were cotransfected with DsRed-mitotracker and stb-siRNA or control siRNA. Mitochondrial distribution was examined by imaging GFP fluorescence (left panels) and DsRed-mitochondria (right panels) in the neurons 4 or 5 d after transfection. Note that in the processes of the neurons expressing the stb-siRNA (B), an abnormally lower density of mitochondria was observed relative to that of the neurons that were transfected with control siRNA (A). Bars, 10 μm. (C–E) Quantification of relative mitochondrial density in the neuronal processes. The transfected neurons were imaged under the same conditions and the same settings below saturation at a resolution of 1,024 × 1,024 pixels (12 bit). One main process (the longest process of each neuron) was traced manually for more than 200 μm in length, starting from the cell body. Normalized mean intensity of mitochondrial fluorescence in neuronal processes was expressed as the mean intensity in arbitrary units per square area of process (C). Alternatively, the relative mitochondrial density was estimated by determining the number of mitochondrial clusters (D) or relative mitochondrial area (E) per μm length of process. All data were obtained from a total of 3708.11 μm of process length of neurons (n = 16) expressing stb-siRNA, and 3786.5 μm of process length of neurons (n = 16) transfected with control siRNA in three independent experiments. Note that the neurons transfected with stb-siRNA resulted in a significant reduction in mitochondrial density within processes by all three of the quantitative methods: mitochondrial mean intensity (C) was 6.29 ± 0.46 (mean ± SEM, P < 0.001); the number of mitochondrial clusters per μm process length (D) was 0.13 ± 0.01 (P < 0.001); and the relative mitochondrial area/μm process length (E) was 2.99 ± 0.30 (P < 0.001), relative to the cells transfected with the control siRNA (10.85 ± 0.63 for mitochondrial mean intensity, 0.20 ± 0.02 clusters/μm process length, and 6.38 ± 0.55 relative mitochondrial area/μm process length). **P < 0.001 relative to control siRNA by t test.
Figure 5.
Figure 5.
Expression of the KHC-CBD or the STB-KBD reduces mitochondrial density in neuronal processes. (A–D) Cultured hippocampal neurons (DIV5) were transfected with DsRed-mitotracker and expression vector encoding GFP control (A), GFP-STB-NT (B), GFP-STB-KBD (C), or GFP-KHC-CBD (D). Mitochondrial distribution in the neuronal processes was examined by imaging GFP fluorescence (top panels) and DsRed-mitochondria (bottom panels) 48–72 h after transfection. Neurons transfected with GFP-KHC-CBD or GFP-STB-KBD showed a marked reduction in the density of mitochondria along the neuronal processes relative to that of neurons transfected with GFP or GFP-STB-NT. Bars, 10 μm. (E–G) Quantification of the relative mitochondrial density in neuronal processes. Relative mitochondrial density was expressed as the fluorescence mean intensity of DsRed-mitotracker per square unit area of process of transfected neurons (E), number of mitochondrial clusters (F), or relative mitochondrial area (G) per μm of process length of transfected neurons. All images were collected under the same settings below saturation and from 15 neurons for each group in three independent experiments. Total process length measured was 4111.7 μm (GFP), 4148 μm (GFP-STB-NT), 3963.74 μm (GFP-STB-KBD), or 3053.97 μm (GFP-KHC-CBD). Histograms indicate mean ± SEM. *P <0.01; **P < 0.002; ***P < 0.001 relative to GFP controls by t test.
Figure 6.
Figure 6.
Syntabulin loss-of-function impairs anterograde movement of mitochondria along axonal processes. Quantification of relative mitochondrial movement in the neurons that were transfected with constructs expressing siRNAs or GFP-fusion proteins. The motility of DsRed-mitotracker–labeled mitochondria was examined in live hippocampal neurons at DIV9–10 after transfection with siRNAs or 48–72 h after transfection at DIV5 with GFP-fusion proteins. The direction of net movement for each mitochondrial organelle along axonal processes was determined during the same time window (15 min) of time-lapse imaging. The relative percentages of stationary, net anterograde, or net retrograde events were calculated. (A) Knockdown of syntabulin inhibits anterograde, but not retrograde, movement of mitochondria along axonal processes. Of a total of 259 mitochondrial clusters from 11 cells that were transfected with the control siRNA, one third of the mitochondrial organelles in the axons are mobile (29.6 ± 3.0%), and moved anterogradely (18.4 ± 2.9%) or retrogradely (11.2 ± 1.6%). Knockdown of syntabulin (total 383 mitochondria from 17 cells) exhibited a marked reduction in anterograde transport (***P < 0.001), a slight but significant increase in stationary mitochondria (*P < 0.02), and no significant change in retrograde movement of mitochondria (P = 0.4). (B) Interfering with the STB–KHC interaction selectively inhibits anterograde trafficking of mitochondria along axonal processes. Note that in the axonal processes of GFP-transfected control neurons, 67.9 ± 3.4%, 18.6 ± 3.1%, or 13.6 ± 1.4% of the mitochondria were immobile, moved in the anterograde direction, or moved in the retrograde direction, respectively. In contrast, the expression of GFP-STB-KBD (n = 376 from 14 cells) or GFP-KHC-CBD (n = 200 from 10 cells) resulted in a remarkable increase in the percentage of immobile mitochondrial during the 15-min observation time (GFP-KHC-CBD: P < 0.005; GFP-STB-KBD: P = 0.05), and a significant reduction in mitochondria moving anterogradely (GFP-STB-KBD: P<0.001; GFP-KHC-CBD: P<0.001). However, retrograde trafficking of mitochondria along the axonal processes exhibited no significant changes in the neurons that were transfected with GFP-STB-KBD (18.8 ± 2.5%, P = 0.23), GFP-KHC-CBD (11.2 ± 2.9%, P = 0.59), or GFP-STB-NT (15.1 ± 2.5%, P = 0.64) relative to those found in GFP-transfected neurons (13.6 ± 1.3%). (Error bars = SEM; *P = 0.05; **P < 0.005; ***P < 0.001 relative to GFP controls by t test).

References

    1. Allen, R.D., J. Metuzals, I. Tasaki, S.T. Brady, and S.P. Gilbert. 1982. Fast axonal transport in squid giant axon. Science. 218:1127–1129. - PubMed
    1. Baas, P.W., J.S. Deitch, M.M. Black, and G.A. Banker. 1988. Polarity orientation of microtubules in hippocampal neurons: uniformity in the axon and nonuniformity in the dendrite. Proc. Natl. Acad. Sci. USA. 85:8335–8339. - PMC - PubMed
    1. Baas, P.W., M.M. Black, and G.A. Banker. 1989. Changes in microtubule polarity orientation during the development of hippocampal neurons in culture. J. Cell Biol. 109:3085–3094. - PMC - PubMed
    1. Banker, G.A., and W.M. Cowan. 1979. Further observations on hippocampal neurons in dispersed cell culture. J. Comp. Neurol. 187:469–493. - PubMed
    1. Bordier, C. 1981. Phase separation of integral membrane proteins in Triton X-114 solution. J. Biol. Chem. 256:1604–1607. - PubMed

Publication types

MeSH terms