. 2006 Jan 26;25(4):609-21.
doi: 10.1038/sj.onc.1209077.

Snail induction is an early response to Gli1 that determines the efficiency of epithelial transformation

Affiliations

Snail induction is an early response to Gli1 that determines the efficiency of epithelial transformation

X Li et al. Oncogene. .

Abstract

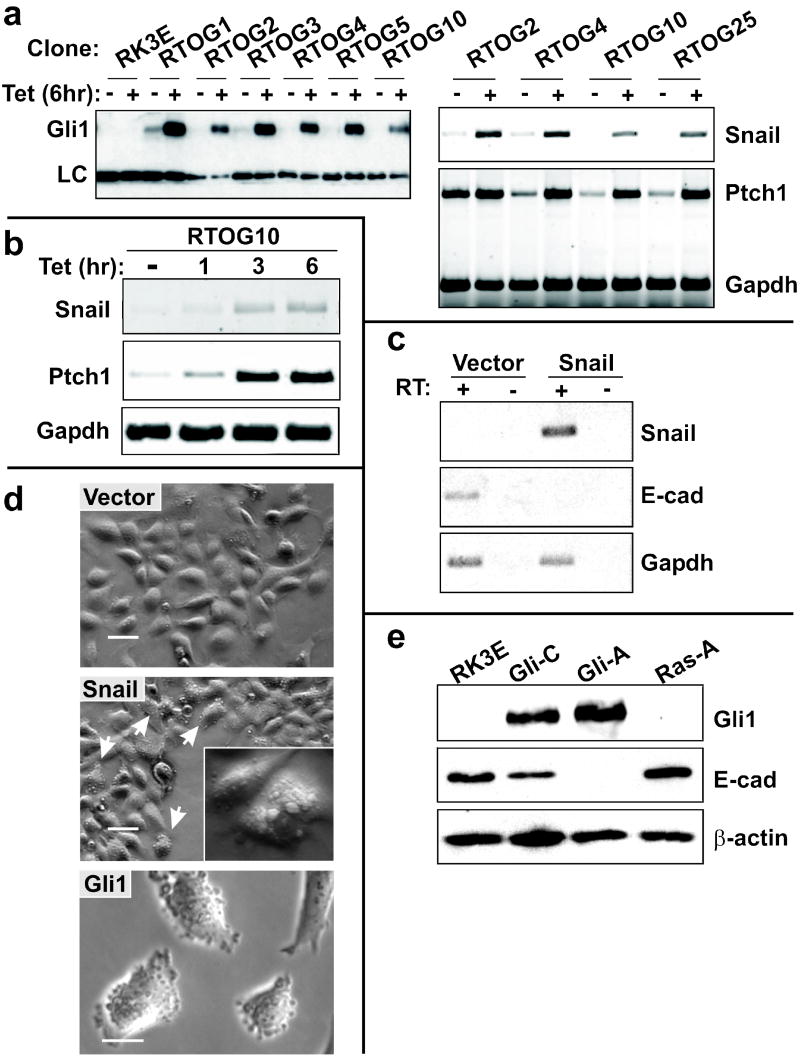
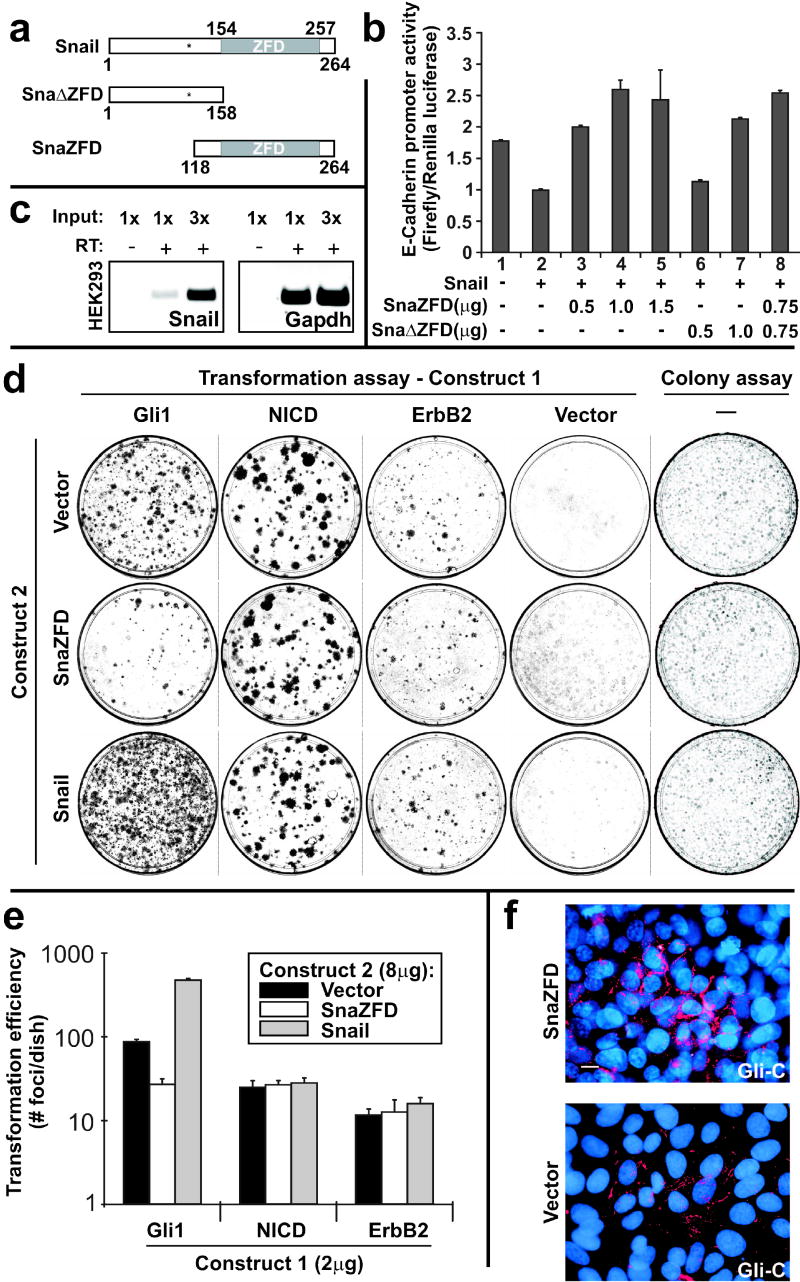
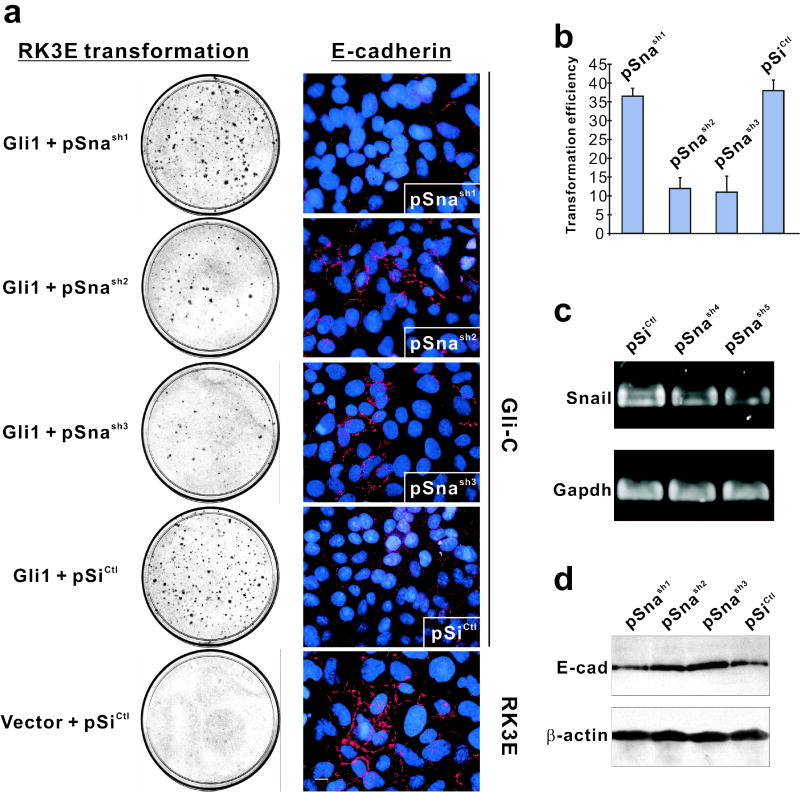
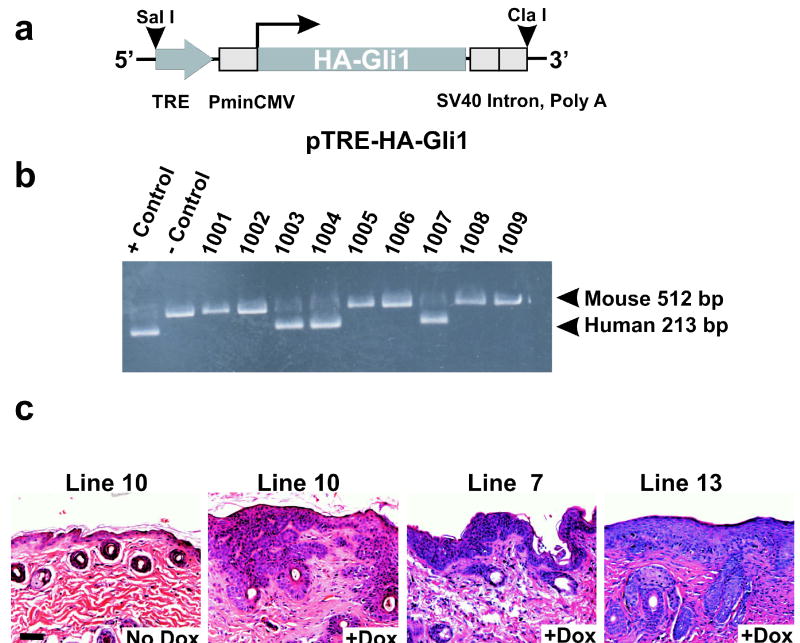
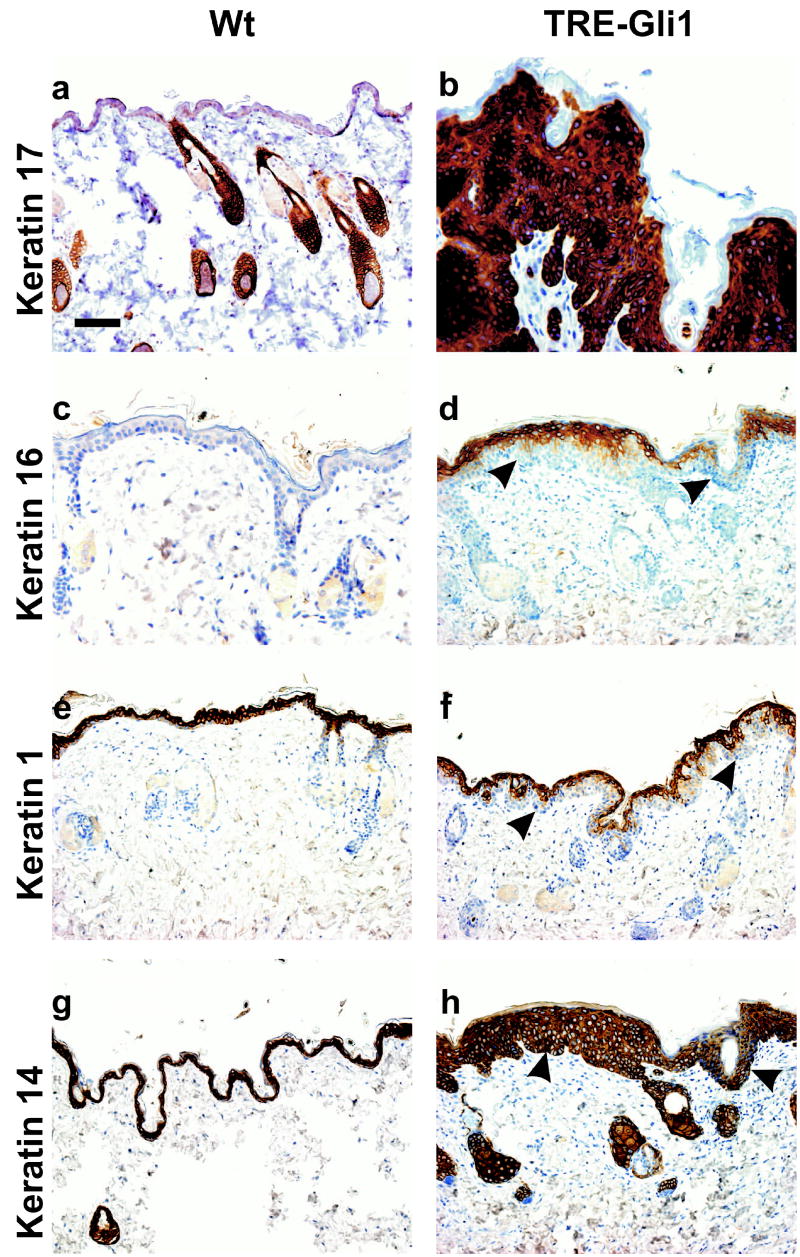
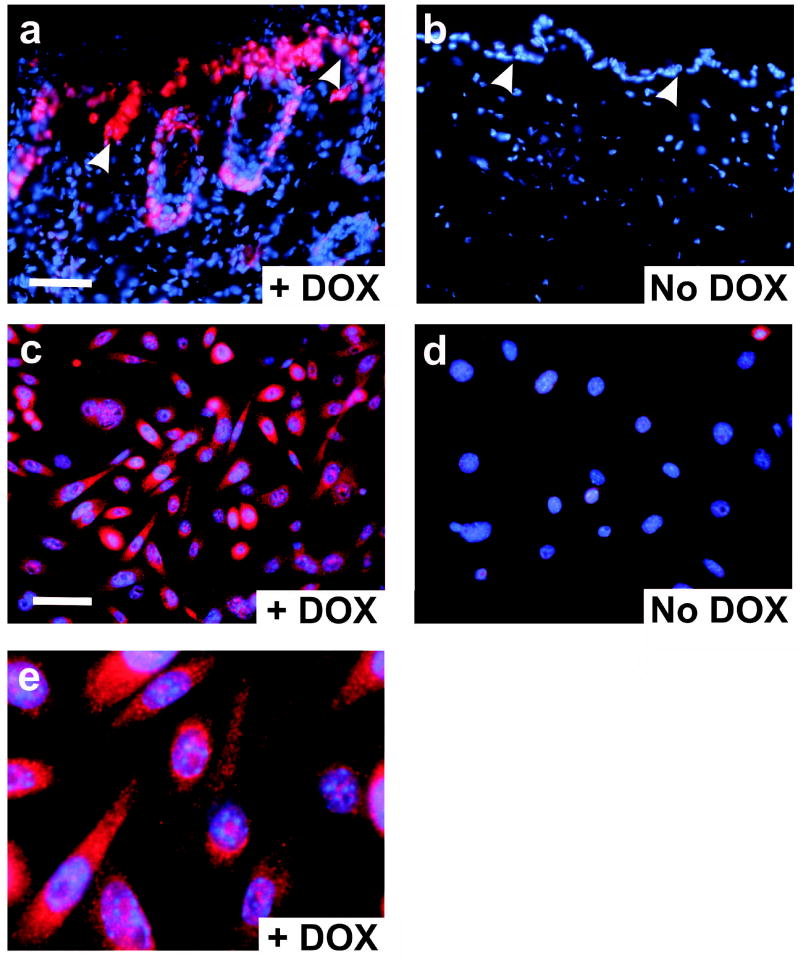
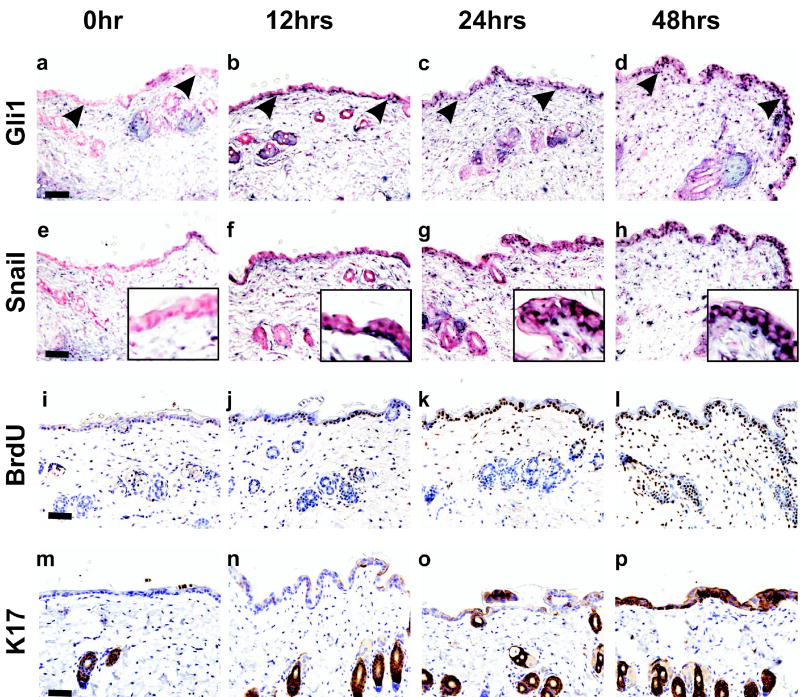
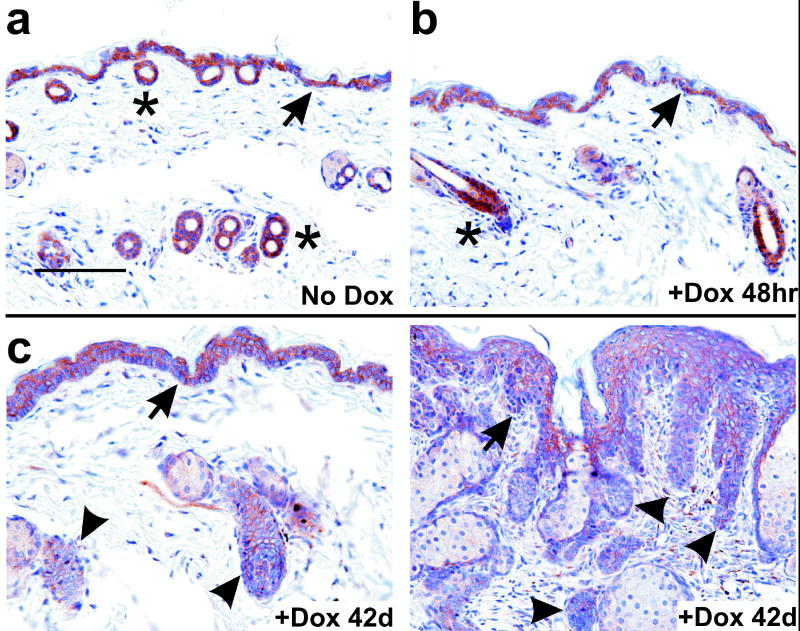
Gli family members mediate constitutive Hedgehog signaling in the common skin cancer, basal cell carcinoma (BCC). Snail/Snai1 is rapidly induced by Gli1 in vitro, and is coexpressed with Gli1 in human hair follicles and skin tumors. In the current study, we generated a dominant-negative allele of Snail, SnaZFD, composed of the zinc-finger domain and flanking sequence. In promoter-reporter assays, SnaZFD blocked the activity of wild-type Snail on the E-cadherin promoter. Snail loss-of-function mediated by SnaZFD or by one of several short hairpin RNAs inhibited transformation of RK3E epithelial cells by Gli1. Conversely, enforced expression of Snail promoted transformation in vitro by Gli1, but not by other genes that were tested, including Notch1, ErbB2, and N-Ras. As observed for Gli1, wild-type Snail repressed E-cadherin in RK3E cells and induced blebbing of the cytoplasmic membrane. Induction of a conditional Gli1 transgene in the basal keratinocytes of mouse skin led to rapid upregulation of Snail transcripts and to cell proliferation in the interfollicular epidermis. Established Gli1-induced skin lesions exhibited molecular similarities to BCC, including loss of E-cadherin. The results identify Snail as a Gli1-inducible effector of transformation in vitro, and an early Gli1-responsive gene in the skin.


Figures

Figure 1
Figure 1
Regulation of Snail and E-cadherin by Gli1 in vitro. (a) RK3E epithelial cells were stably transduced with plasmids conferring tet-inducible Gli1 expression as described in the Materials and Methods. Cell lines were expanded from single colonies, induced with tet or vehicle control for 6 hours, and examined for Gli1 expression by immunoblot (left panel). A smaller, unidentified species detected by the antibody served as a loading control (LC). Semi-quantitative RT-PCR was used to detect the Gli1 target genes Ptch1 and Snail (right panel). (b) The time-course of Ptch1 and Snail induction was examined by RT-PCR analysis of a tet-on Gli1 cell line. Gapdh served as a control. (c) RK3E cells were stably transduced with pBpuro-Snail (Snail cells) or Vector control retrovirus (Vector cells). RT-PCR was used to detect expression of the Snail transgene, endogenous E-cadherin and Gapdh. (d) Morphology of Snail cells, Vector cells, and Gli1-transformed RK3E cells (Gli1 cells) by phase contrast microscopy. Arrows indicate examples of Snail cells with blebbing of the cytoplasmic membrane. Additional examples are shown in greater detail in the inset. Scale bars, 50μm (Vector, Snail) or 20μm (Gli1). (e) Immunoblot analysis utilized parental RK3E and transformed cell lines previously derived from oncogene-transformed foci (Louro et al., 1999). The filter was queried sequentially with the indicated antibodies. β-actin served as a loading control.
Figure 2
Figure 2
Characterization of dominant negative alleles of Snail. (a) Schematic of wild type mouse Snail, Sna ZFD and SnaZFD. The approximate position of GSK3β phosphorylation sites is indicated (asterisk) (Zhou et al., 2004; Yook et al., 2005). (b) Truncated Snail alleles were analyzed for interference with Snail-mediated repression of E-cadherin promoter activity. Plasmids were transfected into HEK293 cells, and cell extracts were analyzed using the Dual Luciferase Reporter Assay. Three experiments were performed in triplicate and standard error bars are shown. (c) Endogenous Snail in HEK293 cells was detected by RT-PCR. No product was detected without addition of RT. (d) Snail and SnaZFD were analyzed for modulation of oncogene transforming activity by lipofectamine-mediated co-transfection of the indicated plasmids (Construct 1, Construct 2) into RK3E cells. Wright-stained petri dishes contained foci of transformed cells on a monolayer of untransformed RK3E (Transformation assay, columns 1–4), or else colonies of puromycin-resistant cells that survived 7 days in selective culture media (Colony assay, column 5). (e) Transformation efficiency was plotted on a log10 scale. Results for Gli1 represent 3 independent experiments performed in triplicate, and standard error bars are shown. Results for NICD and ErbB2 represent one experiment performed in triplicate, and standard deviation bars are shown. (f) Gli-C cells were electroporated with the indicated expression plasmid. A GFP control vector indicated successful transfection of nearly all cells (not shown). E-cadherin expression (red) was visualized 48 hrs post-transfection by indirect immunofluorescence. Nuclei were stained with DAPI (blue). Scale bar, 10μ.
Figure 3
Figure 3
Inhibition of Gli1-mediated transformation by Snail shRNAs. (a) shRNA expression vectors were tested for modulation of Gli1 transforming activity (left) and for ability to alter expression or localization of E-cadherin in Gli-C cells (right). RK3E cells served as a positive control for E-cadherin (bottom right). The transformation assays shown were performed once in triplicate. Similar results were obtained in an independent experiment, performed in duplicate, that utilized distinct shRNA constructs. For immunostaining assays, Gli1-transformed cells were transduced by electroporation with the indicated shRNA expression vector and examined at 72 hrs post-transfection. (b) Quantitation of the transformation assays shown in panel a. Standard deviation bars are shown. (c) RT-PCR analysis of Snail transcripts in Gli1 cells following transient transfection of shRNA constructs. (d) Immunoblot analysis of E-cadherin in Gli1 cells transfected with the indicated construct. β-actin served as a control for loading.
Figure 4
Figure 4
Tet-inducible Gli1 transgenic animals exhibit hyperproliferative skin lesions. (a) Schematic of the HA-tagged, human Gli1 transgene, showing the tet response element (TRE), the minimal CMV promoter (PminCMV), and the SV40 intron and polyadenylation signal. Restriction sites used for generation of the microinjection fragment are shown (SalI, ClaI). (b) PCR analysis used one pair of conserved primers, derived from exons 6 and 7, to detect both the mouse gene and the human transgene. Control DNAs were mouse genomic DNA alone or else mouse DNA admixed with a molar excess of Gli1 cDNA. (c) Histology of the skin following induction of Gli1 for 4 weeks in transgenic lines derived from 3 independent founders. A mouse of line 10 served as a control and exhibited morphologically normal skin (No dox). Scale bar, 50μ.
Figure 5
Figure 5
Immunostaining of Gli1-induced lesions. Dox was administered to wild type (Wt) or TRE-Gli1 mice for 4 weeks, and the indicated antibodies were applied to sections of dorsal skin. Arrowheads indicate the dermo-epidermal junction (DEJ). Scale bar, 50μ.
Figure 6
Figure 6
Expression of Gli1 in tissues and cells by indirect immunofluorescence. Antibody to the aminoterminal HA epitope was used to localize Gli1. All panels show merged red (antibody) and blue (nuclei) images. (a) Frozen section of a Gli1-induced skin lesion following 4 weeks of dox. Arrowheads indicate the DEJ. (b) Control skin from an animal that was not induced with dox. (c) Primary keratinocytes from a K14-rtTAX;TRE-Gli1 newborn mouse were induced with dox overnight. (d) Uninduced keratinocytes from a K14-rtTAX;TRE-Gli1 mouse. (e) Further magnification of the image shown in c. Scale bars, 50μ.
Figure 7
Figure 7
Skin alterations in the period immediately following induction of Gli1. Dox was added to the drinking water of 40 day old K14-rtTAX;TRE-Gli1 littermates for the indicated interval, and the telogen-phase skin was analyzed. Expression of Gli1 (ad) and Snail (eh) were monitored by in situ hybridization using anti-sense RNA probes. A Snail sense probe served as negative control and exhibited no signal in any section (not shown). BrdU incorporation (il) and K17 expression (mp) were determined by immunostaining. Sections taken at 6 hrs were similar to the zero timepoint, indicating that Gli1, Snail, and BrdU were co-induced at 6–12 hrs. Arrowheads point to the DEJ. Insets (eh) show the epidermis at higher magnification. Scale bars, 50μ.
Figure 8
Figure 8
Analysis of E-cadherin expression during Gli1-induced neoplastic progression. (ac) K14-rtTA;TRE-Gli1 mice were induced with dox for the indicated interval. Sections of skin corresponding to no treatment (No Dox); t=6, 12, or 24 hr; or t=42 days were stained in parallel with antibody to E-cadherin. Staining is indicated by a brown precipitate. (c) At 42d, adjacent areas from a single tissue section are shown, corresponding to less involved skin (left panel) or more involved skin (right panel). Arrowheads indicate epithelium with reduced staining. No signal was observed using as control a normal mouse IgG at the same concentration (not shown). Asterisks indicate hair follicles, and arrows indicate the DEJ. Scale bar, 100μ.

References

    1. Agren M, Kogerman P, Kleman MI, Wessling M, Toftgard R. Gene. 2004;330:101–14. 101–114. - PubMed
    1. Ascano JM, Beverly LJ, Capobianco AJ. J Biol Chem. 2003;278:8771–8779. - PubMed
    1. Aszterbaum M, Epstein J, Oro A, Douglas V, LeBoit PE, Scott MP, Epstein EH., Jr Nat Med. 1999;5:1285–1291. - PubMed
    1. Aybar MJ, Nieto MA, Mayor R. Development. 2003;130:483–494. - PubMed
    1. Bachelder RE, Yoon SO, Franci C, Garcia de Herreros A, Mercurio AM. J Cell Biol. 2005;168:29–33. - PMC - PubMed

Publication types