

Evolution of genetic potential
- PMID: 16158095
- PMCID: PMC1193991
- DOI: 10.1371/journal.pcbi.0010032
Evolution of genetic potential
Abstract
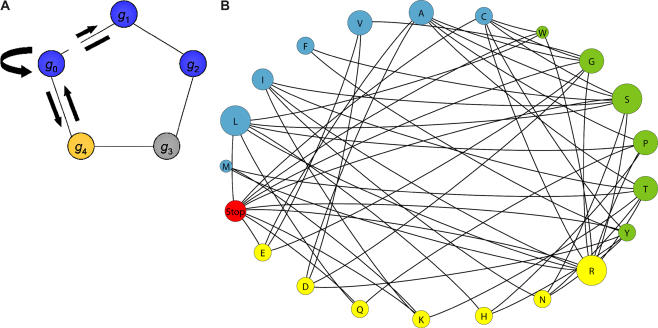
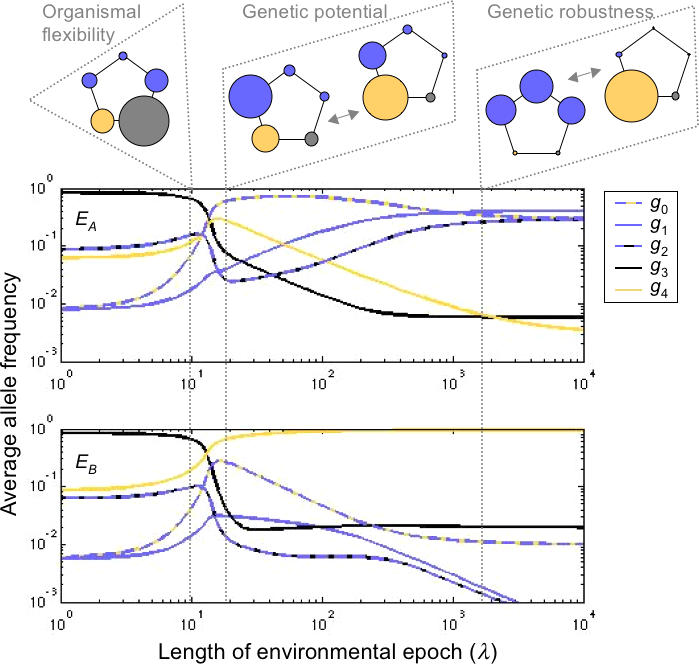
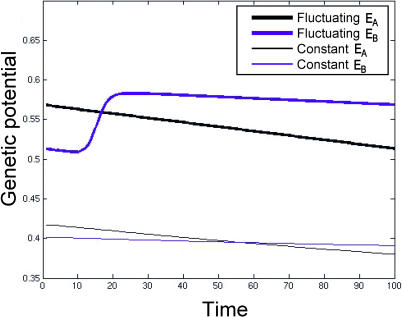
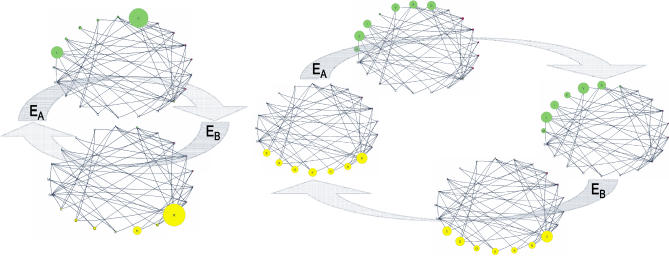
Organisms employ a multitude of strategies to cope with the dynamical environments in which they live. Homeostasis and physiological plasticity buffer changes within the lifetime of an organism, while stochastic developmental programs and hypermutability track changes on longer time-scales. An alternative long-term mechanism is "genetic potential"--a heightened sensitivity to the effects of mutation that facilitates rapid evolution to novel states. Using a transparent mathematical model, we illustrate the concept of genetic potential and show that as environmental variability decreases, the evolving population reaches three distinct steady state conditions: (1) organismal flexibility, (2) genetic potential, and (3) genetic robustness. As a specific example of this concept we examine fluctuating selection for hydrophobicity in a single amino acid. We see the same three stages, suggesting that environmental fluctuations can produce allele distributions that are distinct not only from those found under constant conditions, but also from the transient allele distributions that arise under isolated selective sweeps.
Conflict of interest statement
Figures


Similar articles
-
Mosaic physiology from developmental noise: within-organism physiological diversity as an alternative to phenotypic plasticity and phenotypic flexibility.J Exp Biol. 2014 Jan 1;217(Pt 1):35-45. doi: 10.1242/jeb.089698. J Exp Biol. 2014. PMID: 24353202 Review.
-
Evolution of evolvability and phenotypic plasticity in virtual cells.BMC Evol Biol. 2017 Feb 28;17(1):60. doi: 10.1186/s12862-017-0918-y. BMC Evol Biol. 2017. PMID: 28241744 Free PMC article.
-
Selection in a fluctuating environment leads to decreased genetic variation and facilitates the evolution of phenotypic plasticity.J Evol Biol. 2012 Jul;25(7):1275-90. doi: 10.1111/j.1420-9101.2012.02512.x. Epub 2012 Apr 23. J Evol Biol. 2012. PMID: 22519748
-
Population genetic processes affecting the mode of selective sweeps and effective population size in influenza virus H3N2.BMC Evol Biol. 2016 Aug 3;16:156. doi: 10.1186/s12862-016-0727-8. BMC Evol Biol. 2016. PMID: 27487769 Free PMC article.
-
[Genetics and evolution of developmental plasticity in the nematode C. elegans: Environmental induction of the dauer stage].Biol Aujourdhui. 2020;214(1-2):45-53. doi: 10.1051/jbio/2020006. Epub 2020 Aug 10. Biol Aujourdhui. 2020. PMID: 32773029 Review. French.
Cited by
-
Facilitated variation: how evolution learns from past environments to generalize to new environments.PLoS Comput Biol. 2008 Nov;4(11):e1000206. doi: 10.1371/journal.pcbi.1000206. Epub 2008 Nov 7. PLoS Comput Biol. 2008. PMID: 18989390 Free PMC article.
-
Adaptive plasticity and niche expansion in an invasive thistle.Ecol Evol. 2015 Aug;5(15):3183-97. doi: 10.1002/ece3.1599. Epub 2015 Jul 14. Ecol Evol. 2015. PMID: 26357544 Free PMC article.
-
The role of mutational robustness in RNA virus evolution.Nat Rev Microbiol. 2013 May;11(5):327-36. doi: 10.1038/nrmicro3003. Epub 2013 Mar 25. Nat Rev Microbiol. 2013. PMID: 23524517 Free PMC article. Review.
-
Environmental fluctuations do not select for increased variation or population-based resistance in Escherichia coli.J Biosci. 2016 Mar;41(1):39-49. doi: 10.1007/s12038-016-9592-2. J Biosci. 2016. PMID: 26949086
-
Getting higher on rugged landscapes: Inversion mutations open access to fitter adaptive peaks in NK fitness landscapes.PLoS Comput Biol. 2022 Oct 31;18(10):e1010647. doi: 10.1371/journal.pcbi.1010647. eCollection 2022 Oct. PLoS Comput Biol. 2022. PMID: 36315581 Free PMC article.
References
LinkOut - more resources
Full Text Sources
Research Materials
