Decline of speech understanding and auditory thresholds in the elderly
- PMID: 16158663
- PMCID: PMC1440523
- DOI: 10.1121/1.1953207
Decline of speech understanding and auditory thresholds in the elderly
Abstract
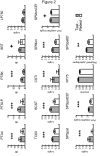
A group of 29 elderly subjects between 60.0 and 83.7 years of age at the beginning of the study, and whose hearing loss was not greater than moderate, was tested twice, an average of 5.27 years apart. The tests measured pure-tone thresholds, word recognition in quiet, and understanding of speech with various types of distortion (low-pass filtering, time compression) or interference (single speaker, babble noise, reverberation). Performance declined consistently and significantly between the two testing phases. In addition, the variability of speech understanding measures increased significantly between testing phases, though the variability of audiometric measurements did not. A right-ear superiority was observed but this lateral asymmetry did not increase between testing phases. Comparison of the elderly subjects with a group of young subjects with normal hearing shows that the decline of speech understanding measures accelerated significantly relative to the decline in audiometric measures in the seventh to ninth decades of life. On the assumption that speech understanding depends linearly on age and audiometric variables, there is evidence that this linear relationship changes with age, suggesting that not only the accuracy but also the nature of speech understanding evolves with age.
Figures


References
-
- Avendano C, Hermansky H. Study on the dereverberation of speech based on temporal envelope filtering. Proc ICSLP'96. 1996:889–892.
-
- Beasley DS, Schwimmer S, Rintelmann WF. Intelligibility of time-compressed CNC monosyllables. J Sp Hear Res. 1972;15:340–350. - PubMed
-
- Bergman M. Aging and the Perception of Speech. University Park Press; Baltimore, MD: 1980.
-
- Bergman M, Blumfield VG, Cascardo D, Dash B, Levitt H, Margulies MK. Age-related decrement in hearing for speech. Sampling and longitudinal studies. J Gerontol. 1976;31:533–538. - PubMed
-
- Bilger RC, Nuetzel JM, Rabinowitz WM, Rzeczkowski C. Standardization of a test of speech perception in noise. J Sp Hear Res. 1984;27:32–48. - PubMed
Publication types
MeSH terms
Grants and funding
LinkOut - more resources
Full Text Sources
Medical

