Comparative Study
. 2005 Sep 13:6:59.
doi: 10.1186/1471-2202-6-59.

Ethanol induces cell-cycle activity and reduces stem cell diversity to alter both regenerative capacity and differentiation potential of cerebral cortical neuroepithelial precursors

Affiliations
Comparative Study

Ethanol induces cell-cycle activity and reduces stem cell diversity to alter both regenerative capacity and differentiation potential of cerebral cortical neuroepithelial precursors

Daniel R Santillano et al. BMC Neurosci. .

Abstract

Background: The fetal cortical neuroepithelium is a mosaic of distinct progenitor populations that elaborate diverse cellular fates. Ethanol induces apoptosis and interferes with the survival of differentiating neurons. However, we know little about ethanol's effects on neuronal progenitors. We therefore exposed neurosphere cultures from fetal rat cerebral cortex, to varying ethanol concentrations, to examine the impact of ethanol on stem cell fate.

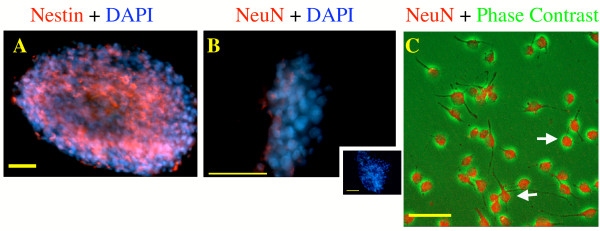
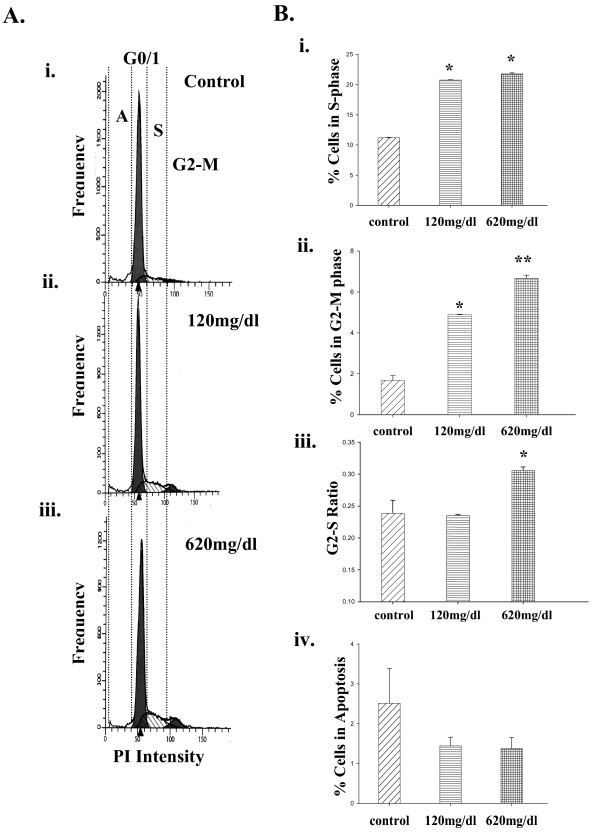
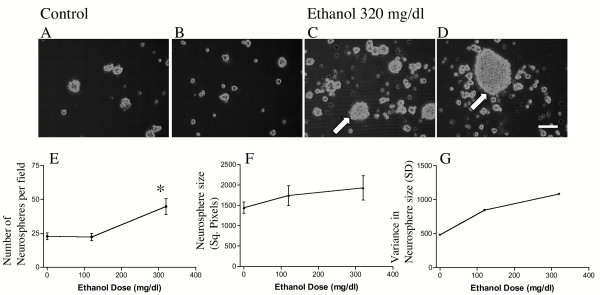
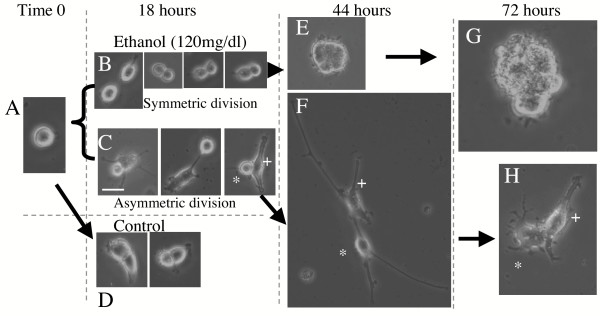
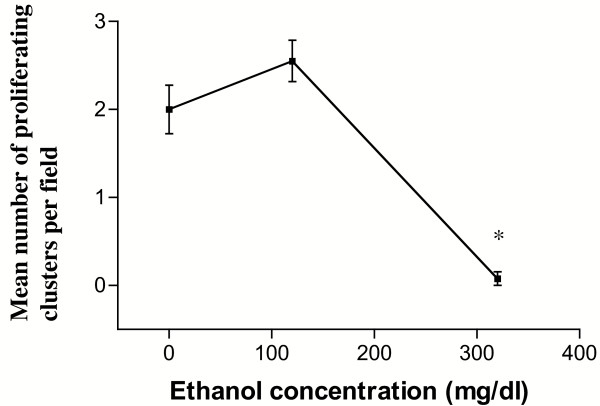
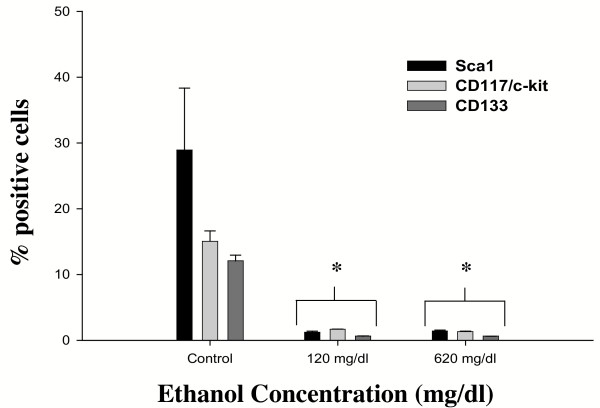
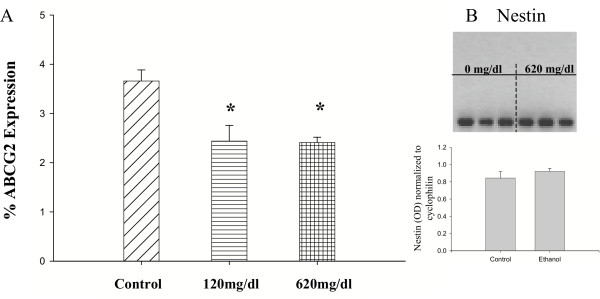
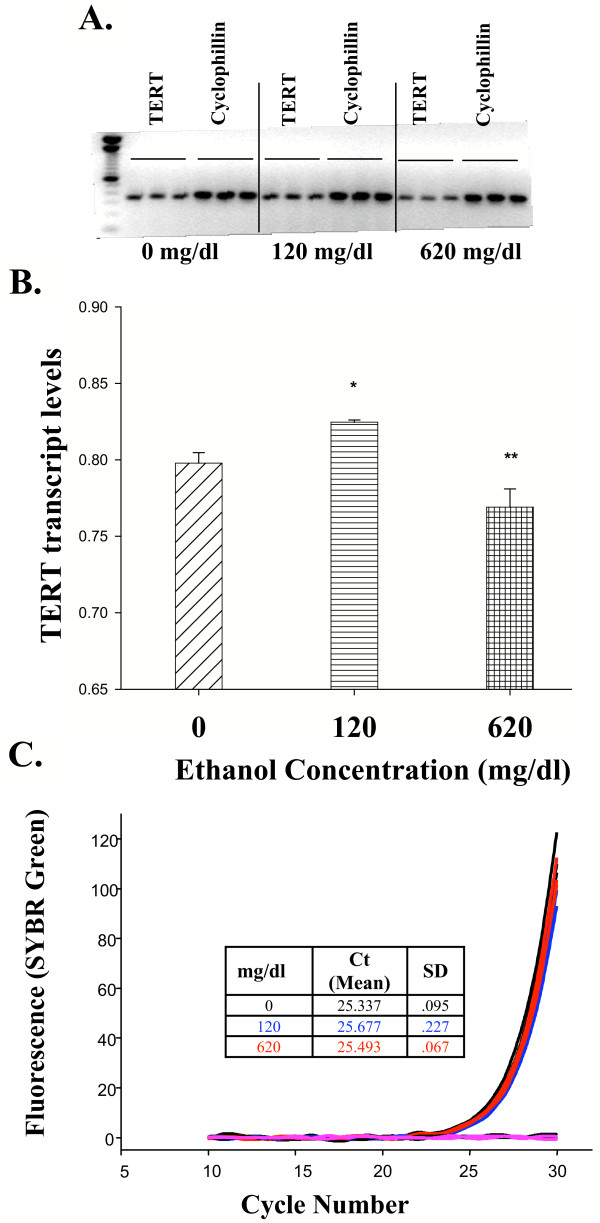
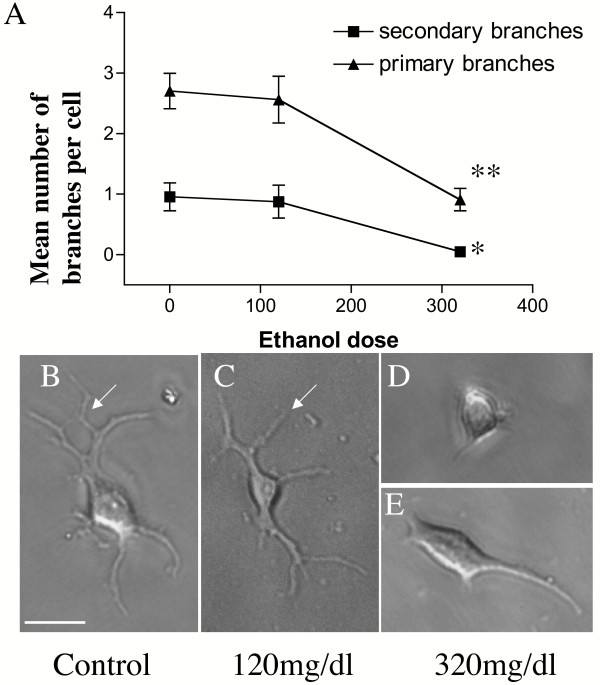
Results: Ethanol promoted cell cycle progression, increased neurosphere number and increased diversity in neurosphere size, without inducing apoptosis. Unlike controls, dissociated cortical progenitors exposed to ethanol exhibited morphological evidence for asymmetric cell division, and cells derived from ethanol pre-treated neurospheres exhibited decreased proliferation capacity. Ethanol significantly reduced the numbers of cells expressing the stem cell markers CD117, CD133, Sca-1 and ABCG2, without decreasing nestin expression. Furthermore, ethanol-induced neurosphere proliferation was not accompanied by a commensurate increase in telomerase activity. Finally, cells derived from ethanol-pretreated neurospheres exhibited decreased differentiation in response to retinoic acid.

Conclusion: The reduction in stem cell number along with a transient ethanol-driven increase in cell proliferation, suggests that ethanol promotes stem to blast cell maturation, ultimately depleting the reserve proliferation capacity of neuroepithelial cells. However, the lack of a concomitant change in telomerase activity suggests that neuroepithelial maturation is accompanied by an increased potential for genomic instability. Finally, the cellular phenotype that emerges from ethanol pre-treated, stem cell depleted neurospheres is refractory to additional differentiation stimuli, suggesting that ethanol exposure ablates or delays subsequent neuronal differentiation.


Figures

Figure 1
Figure 1
Photomicrographs depicting immunofluorescence analysis of neurospheres labeled for intermediate filament proteins nestin (A), and the neuronal lineage marker, the neuronal-specific nuclear antigen, NeuN (B and lower magnification inset). Cell nuclei were counter-stained with DAPI (blue). Control neurosphere cultures are immuno-positive for nestin. However, cultures do not exhibit nuclear localization of NeuN, showing that neurosphere cultures were comprised of immature cells. (C) Differentiation following removal of the mitogen EGF, and dispersion of cells onto a laminin substrate, results in the upregulation and nuclear localization of NeuN. Photomicrograph represents a digitally merged immunofluorescence and phase contrast microscopic image showing NeuN immunofluorescence overlying nuclei (white arrows) of early differentiating neurons. Scale bars: 50 uM.
Figure 2
Figure 2
(A) Cell-cycle analysis of cortical progenitors treated with ethanol for 4 days. (Ai-iii) Flow-cytometric frequency histograms of progenitors stained with propidium iodide (PI) for DNA content. (Aii,iii) Ethanol stimulates DNA synthesis and cell-cycle progression, as indicated by the increase in area under the S-phase and G2/M peaks, relative to controls. Bi-iii, Quantitative analyses of cell-cycle. (Bi,ii) Ethanol significantly increased the number of cells entering S and G2/M-phases of the cell-cycle. (Biii) The G2/S ratio was unchanged at low ethanol doses, but significantly increased with the high dose. (Biv) Ethanol did not induce apoptosis at either dose used, and very little DNA fragmentation was observed in the sub-G0/1 range in (Ai-iii). Asterisks indicate statistical-significance, p < 0.05.
Figure 3
Figure 3
Ethanol increases neurosphere number and increases variation in the size of neurospheres. (A-D) Representative photomicrographs of control (A,B) and ethanol-treated (C,D) neurospheres showing that ethanol (at 5 days exposure) increases both the density and size variation of neurospheres. Arrows mark the appearance of large neurospheres in ethanol-treated cultures. (E-G) Morphometric analyses show that ethanol induces a significant increase in the density of neurospheres (E), without altering the mean area per neurosphere (in square pixels, F). However, ethanol induced a dose-related increase in variation (Standard Deviation) in neurosphere size (G). Asterisks indicate statistical-significance, p < 0.05. Scale bar: A-D, 100 uM.
Figure 4
Figure 4
Ethanol induces asymmetric division of neural progenitor cells. Dissociated neural progenitor cells (A) cultured under mitogenic conditions divide symmetrically to generate two similar daughter cells (D, representative examples of cells undergoing cytokinesis), and regenerate new neurospheres (data not shown). Ethanol (120 mg/dl)-treated neural progenitors also generate daughter cells by symmetrical division (B, examples of cells in different stages of cytokinesis), to regenerate neurospheres over a period of 44 (E) and 72 (G) hours, under mitogenic conditions. However, despite being cultured under mitogenic conditions, ethanol-treated progenitors also exhibit asymmetric division to generate morphologically dissimilar daughter cells (C, examples of asymmetrical division, showing daughter cells in different stages of cytokinesis). Over the period of 44 to 72 hours, one daughter cell exhibits somatic mobility (e.g., F,H, cell marked by a *), while the second daughter cells remains stationary (e.g., F,H, cell marked by +). The motile daughter cell transiently exhibits long filamentous processes (F,*), though these processes retract over a period of 72 hours (H,*), in mitogenic medium.
Figure 5
Figure 5
Quantitative analysis of the effect of ethanol-pretreatment on the regenerative capacity of neural progenitor cells. Neurosphere cultures were treated with varying doses of ethanol for five days, then dissociated and cultured as individual progenitor cells, in ethanol-free mitogenic medium. Ethanol pre-treatment leads to a dose-related decline in the subsequent ability of neural progenitors to undergo cell division (mean number of dividing cells per well ± SEM) and generate clonal colonies of cells. Asterisks indicate statistical-significance, p < 0.05.
Figure 6
Figure 6
Quantitative analysis of flow-cytometric data for stem-cell antigen expression in cortical progenitors. Progenitors express stem-cell antigens (control). After 4 days of treatment, low doses of ethanol significantly reduced the proportion of cells expressing Sca-1, CD117/C-kit and CD133. The high dose of ethanol did not further reduce stem-cell antigen expression. Asterisks indicate statistical-significance, p < 0.05. Data were collected from at least 10,000 events/sample.
Figure 7
Figure 7
(A) ABCG2 Transporter expression in cortical progenitors after ethanol treatment. Cultures w ere exposed to ethanol and live, immuno-labeled cells were processed for FACS analysis (see methods) with antibodies to surface ABCG2. Ethanol significantly reduced the expression of ABCG2 (p < 0.05). Data were collected from 100,000 events/sample. (B) RT-PCR analysis for nestin in cortical progenitors treated with ethanol for 4 days. The levels of each transcript were unchanged by ethanol. Transcript levels were normalized to cyclophilin (data not shown).
Figure 8
Figure 8
(A,B) TERT mRNA expression and telomerase activity in cortical-derived neurospheres treated with ethanol for 4 days. (A), RT-PCR for the TERT transcript. (B), Quantification of TERT levels in A, expressed as a ratio to cyclophilin. Low doses of ethanol modestly, but significantly, increased TERT transcript levels. However, high doses of ethanol decreased TERT mRNA expression. (C), TRAP assays revealed no differences in telomerase activity between treated and control groups. The cycle threshold value (Ct) indirectly measures activity; a lower Ct corresponds to higher telomerase activity. Inset table indicates Ct ± Standard Deviation (SD). Color code: Black, control; blue, 120 mg/dl; red, 620 mg/dl; pink, no-telomerase control. Asterisks indicate statistical-significance, p < 0.05.
Figure 9
Figure 9
Pre-treatment with ethanol disrupts retinoic acid-mediated differentiation. Neurosphere cultures were exposed to a dose range of ethanol for 4 days, dissociated into a single cell suspension, plated and then differentiated with retinoic acid (A) Quantitative analysis of the mean number (± SEM) of primary and secondary branches per cell, formed in the presence of retinoic acid, as a function of ethanol pre-treatment dose. Asterisks indicate statistically significant differences from non-ethanol exposed, control cultures, * = p < 0.003; ** = p < 0.0001. (B-E) Representative photomicrographs of branching patterns observed in the presence of retinoic acid, in control (B), low (C) and moderate doses (D,E) of ethanol. Arrows point to second-order branches, which are missing in cells derived from neurosphere cultures exposed to 320 mg/dl ethanol. Scale bar, B-E, 25 uM

References

    1. Coles CD, Platzman KA, Raskind-Hood CL, Brown RT, Falek A, Smith IE. A comparison of children affected by prenatal alcohol exposure and attention deficit, hyperactivity disorder. Alcohol Clin Exp Res. 1997;21 :150–161. - PubMed
    1. Kodituwakku PW, May PA, Clericuzio CL, Weers D. Emotion-related learning in individuals prenatally exposed to alcohol: an investigation of the relation between set shifting, extinction of responses, and behavior. Neuropsychologia. 2001;39:699–708. doi: 10.1016/S0028-3932(01)00002-1. - DOI - PubMed
    1. Mattson SN, Riley EP, Delis DC, Stern C, Jones KL. Verbal learning and memory in children with fetal alcohol syndrome. Alcohol Clin Exp Res. 1996;20 :810–816. - PubMed
    1. Mattson SN, Goodman AM, Caine C, Delis DC, Riley EP. Executive functioning in children with heavy prenatal alcohol exposure. Alcohol Clin Exp Res. 1999;23 :1808–1815. - PubMed
    1. Roebuck TM, Simmons RW, Mattson SN, Riley EP. Prenatal exposure to alcohol affects the ability to maintain postural balance. Alcohol Clin Exp Res. 1998;22 :252–258. - PubMed

Publication types

MeSH terms