. 2005 Sep;187(18):6258-64.
doi: 10.1128/JB.187.18.6258-6264.2005.

Towards a genome-based taxonomy for prokaryotes

Affiliations

Towards a genome-based taxonomy for prokaryotes

Konstantinos T Konstantinidis et al. J Bacteriol. 2005 Sep.

Abstract

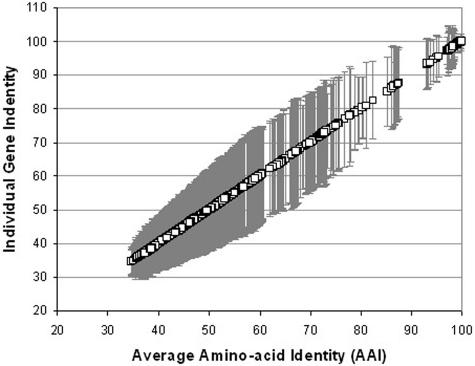
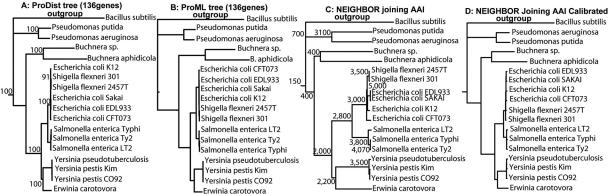
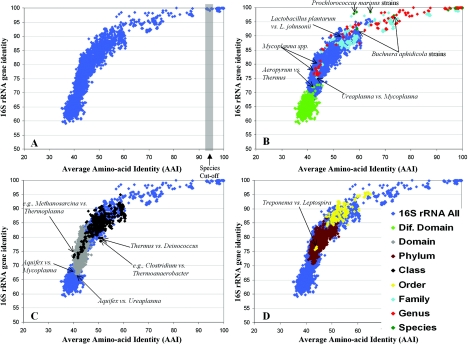
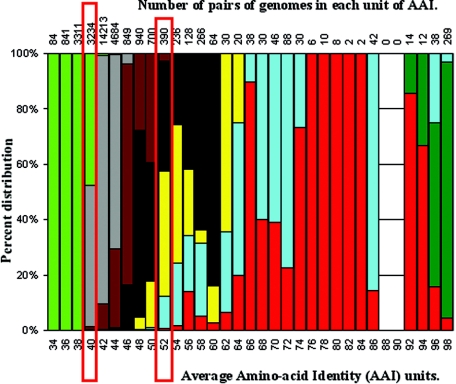
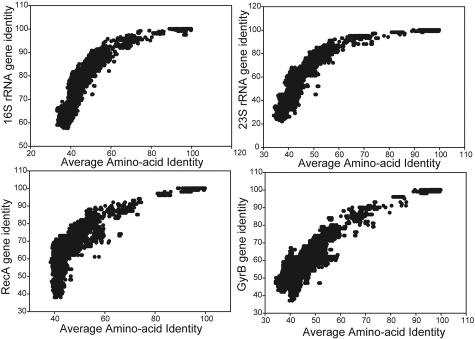
The ranks higher than the species in the prokaryotic taxonomy are primarily designated based on phylogenetic analysis of the 16S rRNA gene sequences, but no definite standards exist for the absolute relatedness (measured by 16S rRNA or other means) between the ranks. Accordingly, it remains unknown how comparable the ranks are between different organisms. To gain insights into this question, we studied the relationship between shared gene content and genetic relatedness for 175 fully sequenced strains, using as a robust measure of relatedness the average amino acid identity (AAI) of the shared genes. Our results reveal that adjacent ranks (e.g., phylum versus class) frequently show extensive overlap in terms of genetic and gene content relatedness of the grouped organisms, and hence, the current system is of limited predictive power in this respect. The overlap between nonadjacent ranks (e.g., phylum versus family) is generally limited and attributable to clear inconsistencies of the taxonomy. In addition to providing means for standardizing taxonomy, our AAI-based approach provides a means to evaluate the robustness of alternative genetic markers for phylogenetic purposes. For instance, the 23S rRNA gene was found to be as good a marker as the 16S rRNA gene, while several of the widely distributed protein-coding genes, such as the RNA polymerase and gyrase subunits, show a strong phylogenetic signal, albeit less strong than the rRNA genes (0.78 > R2 > 0.69 for the protein-coding genes versus R2 = 0.84 for the rRNA genes). The AAI approach outlined here could contribute significantly to a genome-based taxonomy for all microbial organisms.


Figures

FIG. 1.
FIG. 1.
Individual gene identity versus genome average identity. For each pair of genomes (175 genomes; 30,625 pairs), we determined the AAI, as well as the identity of each individual gene conserved (two-way BLAST; see Materials and Methods), between the two genomes. The identity of each gene was compared to the corresponding AAI value, and the variation of the identities of individual genes from the AAI, represented as 1 standard deviation from the AAI (y axis), is plotted against the corresponding AAI value (x axis). The average variation was ∼8.4 (STDEV = 1.85). These results demonstrate that the identities of the majority (>70%) of the genes conserved between two genomes are within approximately ±8.4% of the average of the genome (i.e., AAI), and this is independent of the genetic distance between the two genomes.
FIG. 2.
FIG. 2.
Phylogenetic reconstruction based on AAI versus whole-genome sequence analysis. The shared gene core between the 17 proteobacteria and Bacillus subtilis (outgroup) was determined, using a two-way BLAST approach, to be 136 genes, and these core genes were used to build the phylogenetic trees shown. (A and B) A distance and a maximum likelihood tree, respectively, built with the ProtDist and ProML algorithms of the Phylip package (13) using default settings and, as input sequence, the concatenated protein sequences of all 136 core genes aligned with the ClustalW software (6). The numbers on the nodes of the distance tree (A) indicate the statistical support of the node by 100 bootstrap replicates with ProtDist. All nodes (even the ones not shown for simplicity) have 100 bootstrap values, except for the node connecting strain K-12 to the two Shigella strains, which has 91. (C) The AAI-based tree. The numbers on the nodes of the AAI tree are rough approximations of the number of genes shared (and used in the calculations of AAI) by the genomes grouped at the node. The exact number of genes depends on the specific pair of genomes used. (D) The AAI tree calibrated as described in Materials and Methods.
FIG. 3.
FIG. 3.
Relationships between 16S rRNA, AAI, and taxonomic information for the 175 sequenced genomes. Each dot represents a comparison between two genomes and shows their 16S rRNA gene identity (y axes) plotted against the AAI of the genes shared between the two genomes (x axes) (A). The smallest classification rank that the two genomes of each pair (30,635 pairs in total) share has been overlaid on the graph with a color, which corresponds to the rank, in panels B, C, and D. (B to D) Pairs of genomes whose smallest shared rank is the species, genus, family, or different domain (B); the same domain or class (C); and the phylum or order (D). The ranks have been laid out in panels B, C, and D so as to avoid overlap as much as possible within the same panel. The area that corresponds to the current standards for species delineation (panel A; see the text) (18), as well as representative pairs of genomes (discussed in the text), are shown.
FIG. 4.
FIG. 4.
In-depth calculation of the extent of AAI overlap between the ranks of taxonomy. We determined the number of pairs of genomes (top; x axis) related at any given unit of AAI (bottom; x axis), as well as the smallest taxonomic rank that each pair of genomes shares. The bars show the percent distribution (or overlap) of the taxonomic ranks for each unit of AAI (for an example related to the bars outlined in red, see the text). The color representation of the ranks is identical to that of Fig. 3.
FIG. 5.
FIG. 5.
Correlations between alternative phylogenetic markers to AAI. Shown are the correspondences between the identity of a molecular marker (panel title; y axis) and AAI (x axis) for all pairs of the 175 genomes that have a clear homolog of the marker (at least 20,000 pairs for each gene) used in this study. The full-name descriptions of markers are given in Table 1.

Comment in

  • Updating prokaryotic taxonomy.
    Rosselló-Mora R. Rosselló-Mora R. J Bacteriol. 2005 Sep;187(18):6255-7. doi: 10.1128/JB.187.18.6255-6257.2005. J Bacteriol. 2005. PMID: 16159756 Free PMC article. No abstract available.

Similar articles

Cited by

References

    1. Altschul, S. F., T. L. Madden, A. A. Schaffer, J. Zhang, Z. Zhang, W. Miller, and D. J. Lipman. 1997. Gapped BLAST and PSI-BLAST: a new generation of protein database search programs. Nucleic Acids Res. 25:3389-3402. - PMC - PubMed
    1. Brenner, D., J. Staley, and N. Krieg. 2000. Classification of prokaryotic organisms and the concept of bacterial speciation, p. 27-31. In D. R. Boone, R. W. Castenholz, and G. M. Garrity (ed.), Bergey's manual of systematic bacteriology, 2nd ed., vol. 1. Springer-Verlag, New York, N.Y.
    1. Brown, J. R., C. J. Douady, M. J. Italia, W. E. Marshall, and M. J. Stanhope. 2001. Universal trees based on large combined protein sequence data sets. Nat. Genet. 28:281-285. - PubMed
    1. Canale-Parola, E. 1984. Order I: Spirochaetales Buchanan 1917, 163AL, p. 38-39. In N. R. Krieg, N. and J. G. Holt (ed.), Bergey's manual of systematic bacteriology, vol. 1. William and Wilkins, Baltimore, Md.
    1. Charlebois, R. L., and W. F. Doolittle. 2004. Computing prokaryotic gene ubiquity: rescuing the core from extinction. Genome Res. 14:2469-2477. - PMC - PubMed

Publication types

LinkOut - more resources