. 2005 Sep 14;25(37):8543-54.
doi: 10.1523/JNEUROSCI.1668-05.2005.

Brainstem and forebrain contributions to the generation of learned motor behaviors for song

Affiliations

Brainstem and forebrain contributions to the generation of learned motor behaviors for song

Robin C Ashmore et al. J Neurosci. .

Erratum in

  • J Neurosci. 2005 Sep 28;25(39):table of contents

Abstract

Brainstem nuclei have well established roles in generating nonlearned rhythmic behaviors or as output pathways for more complex, forebrain-generated behaviors. However, the role of the brainstem in providing information to the forebrain that is used to initiate or assist in the control of complex behaviors is poorly understood. In this study, we used electrical microstimulation in select nuclei of the avian song system combined with recordings of acoustic and respiratory output to examine how forebrain and brainstem nuclei interact in the generation of learned vocal motor sequences. We found that brief stimulation in the forebrain nuclei HVC (used as a proper name) and RA (robust nucleus of the arcopallium) caused a short-latency truncation of ongoing song syllables, which ultimately led to a cessation of the ongoing motor sequence. Stimulation within the brainstem inspiratory-related nucleus paraambigualis, which receives input from RA and projects back to HVC via the thalamus, caused syllable truncations and interruptions similar to those observed in HVC and RA. In contrast, stimulation in the tracheosyringal portion of the hypoglossal nucleus, which innervates the syrinx (the avian vocal organ) but possesses no known projections back into the song system, did not cause any significant changes in the song motor pattern. These findings suggest that perturbation of premotor activity in any nucleus within the recurrent song system motor network will disrupt the ongoing song motor sequence. Given the anatomical organization of this network, our results are consistent with a model in which the brainstem respiratory nuclei form an integral part of the song motor programming network by providing timing signals to song control nuclei in the forebrain.


Figures

Figure 1.
Figure 1.
Diagram of the avian song system emphasizing its bilateral organization and the bilateral projections from the brainstem to the forebrain. The portion of the song system that is thought to be involved in song pattern generation is highlighted in gray. This loop consists of the forebrain nucleus HVC, the dRA, the vocal-respiratory network (highlighted in darker gray), and Uva. The vocal-respiratory network is made up of RAm, PAm, and DM (dorsomedial nucleus of the intercollicular complex). The thalamic nucleus DMP and MMAN have been suggested to play an indirect role in motor production (Foster and Bottjer, 2001; Coleman and Vu, 2005) (for review, see Schmidt et al., 2004). Although NIf receives inputs from Uva and sends a strong projection to HVC, it does not appear to be directly involved in song motor patterning in the zebra finch (Cardin et al., 2005) (but see Hosino and Okanoya, 2000). The connection between vRA and nXIIts serves as an output pathway to the syrinx rather than as part of the song pattern generator. INSP and EXP represent, respectively, the inspiratory and expiratory motor neurons. The circuit known as the anterior pathway, which is made up of Area X, DLM, and LMAN, is not necessary for song production but plays an important role in song learning and maintenance. Numbers indicate sites at which stimulation was performed. The three parallel lines between hemispheres illustrate the lack of commissural connections between forebrain song control nuclei. Many of the nuclei in the vocal motor system (DMP, RAm, PAm, and DM), however, project directly or indirectly to vocal motor nuclei in the contralateral hemisphere. Although these projections are bilateral, we only illustrate projections from the left to the right hemisphere for simplicity. Nuclei receiving contralateral inputs are highlighted in dark gray. The anatomical connections shown in this diagram represent the major projections in the song system and have been compiled from a number of different sources (Stokes et al., 1974; Nottebohm et al., 1982; Vicario, 1991; Vates et al., 1997; Reinke and Wild, 1998; Striedter and Vu, 1998; Sturdy et al., 2003; Wild, 2004a,b). Weak projections have been left out. DLM, Medial part of the dorsolateral thalamic nucleus; DMP, dorsomedial posterior nucleus of the thalamus; LMAN, lateral magnocellular nucleus of the anterior nidopallium; MMAN, medial magnocellular nucleus of the anterior nidopallium; Area X, Area X of the medial striatum; NIf, nucleus interfacialis of the nidopallium.
Figure 2.
Figure 2.
Effects on song from stimulation in HVC. A, Syllable-level effects. The same syllable is shown in its normal unstimulated state (left), truncated by a brief stimulus applied to HVC (center), and distorted by a similar intensity stimulus (right). The arrow indicates the time of stimulation in each case. B, Song-level effects. The top most sonogram is an example of a normal song. In the example below it, microstimulation caused the ongoing motif to stop prematurely and then restart with a new motif (motif restart) after producing two introductory notes (i). In the bottom example, microstimulation caused the ongoing motif to stop prematurely (song stop), with no subsequent song production. In both of these examples, song stops and restarts are accompanied by a truncation of the ongoing syllable. Alphabetical letters symbolize the different syllables in each motif. A* indicates a truncated version of syllable A.
Figure 3.
Figure 3.
Quantification of syllable and song-level effects after stimulation in HVC. A, Total number of songs showing different effects from HVC stimulation, of a total of 2735 stimulated songs in four birds. These values represent stimulation at intensities ranging from 15 to 60μA. Syllable-level effects are shown on the left, comprising either truncation of the ongoing syllable (truncate, light gray) or acoustic and/or spectral distortion of the stimulated syllable (distort, dark gray). Syllables in which stimulation had no effect are not shown. These two effects are mutually exclusive. Song-level effects are shown on the right and comprise song stopping (stop, light gray) or stopping followed by restarts of a new motif (restart, dark gray). These two effects are also mutually exclusive. B, Syllable-level effects resulting from HVC stimulation at different current intensities. C, Song-level effects resulting from HVC stimulation at different current intensities. All categories in B and C are compared with percentages collected for a control set of songs with no stimulation (CONT). Significance levels were measured using a G test comparing each stimulus intensity category with the control category for each bird. *p < 0.001. D, Relationship between syllable truncation and song-level effects. Syllable truncation was followed by either a song stop (light gray) or a motif restart (dark gray). In only a small percentage of cases (2.8%, all birds and all stimulus intensities) was syllable truncation not followed by any song-level effect (white).
Figure 4.
Figure 4.
Characteristics of syllable truncation after stimulation. A, Relationship of stimulation times to syllable truncation in a sample syllable. In the top panel, each tick mark represents the time of stimulus delivery to an instance of the syllable. The distribution of syllable lengths resulting from these stimulations (middle panel) illustrates that the length of truncated syllables is evenly distributed (gray bars) throughout the duration (∼170 ms) of a normal unstimulated syllable. The y-axis represents the percentage of all truncated syllables analyzed for this bird. For comparison, the distribution of syllable lengths for unstimulated instances of the syllable is shown below (black), along with typical times for the note transition (white) in that syllable. The mean time from stimulus onset to truncation (truncation latency) is shown as a dotted line for reference and represents the expected delay from stimulation time to truncation time. The bottom two traces represent, respectively, the spectrogram and acoustic waveform of the syllable. B, Compiled distribution of truncation times for all birds. For each bird, one long syllable (ranging from 102 to 207 ms) was chosen to analyze the distribution of truncated syllable lengths. As described above, stimulation times are shown in the top panel as thin lines and are normalized such that 100% represents the mean length of each syllable. The length of stimulated (gray) and unstimulated (black) syllables is plotted in the bottom panel. C, Histogram of syllable truncation latencies after stimulation in HVC, for a total of 111 syllables representing a sample syllable for each of four birds. Bin size, 10 ms. D, Truncation latency as a function of time of stimulation. Truncation latencies are shown for four birds, plotted against the time of stimulation shown as the percentage of syllable length. As the trend line indicates, there is no correlation between the time of stimulation and truncation latency.
Figure 5.
Figure 5.
Effects of HVC stimulation on air sac pressure. A, During quiet respiration, HVC stimulation caused a small, brief increase in air sac pressure. Each trace represents the average of multiple (55–96) air sac pressure traces, aligned with the time of unilateral HVC stimulation at four different current intensities (15, 30, 45, and 60μA). All traces represent stimulation in one bird. The white box starting at 0 ms represents the period of stimulation. B, During song, stimulation causes a short-latency deviation from the stereotyped respiratory pattern. The dark gray trace is the mean of multiple (n = 18) air sac pressure traces recorded during production of the three sequential syllables in the bird's motif. The light gray zone surrounding this unstimulated air sac pressure trace represents 2 SDs from the mean trace. The black line in this figure represents the air sac pressure trace recorded for a stimulated syllable. Stimulus time is represented by the double dotted lines. Sample spectrograms for both the unstimulated and stimulated syllables are shown at the bottom. In this example, stimulation resulted in a syllable truncation. C, Example of a stimulation-induced change in air sac pressure that does not result in a song-level effect. The top two traces represent, respectively, the acoustic waveform and the air sac pressure trace of two sequential motifs. A stimulus was delivered during the production of the syllable B. Higher magnification of this syllable is shown in the bottom panel, with the stimulus shown by the arrow and the white box. The envelope of the air sac pressure trace is similar to that described above, with the stimulated syllable in black and the control trace in gray. The gray zone surrounding the control trace represents 2SDs from the mean. In this example, the song shows no song-level effects despite a clear decrease in air sac pressure in the stimulated syllable. D, Relationship between stimulus-induced changes in air sac pressure and song-level effects. The presence or absence of song-level effects was measured in the subset of cases in which stimulation caused a significant change in air sac pressure. The majority of syllables that showed a significant change in air sac pressure after stimulation were also followed by either motif restarts or song stops. However, some syllables (10 of 46 syllables) failed to show any song-level effects despite the stimulus-induced decrease in air sac pressure.
Figure 6.
Figure 6.
Latency to truncation after HVC stimulation at different levels of the song motor control system. Latency to syllable truncation (Acoustic truncate) was significantly longer than the latency to air sac pressure change (Air sac pressure change). This air sac pressure change latency is also shorter than the latency to suppression of premotor activity in the contralateral HVC (Contra HVC neural reset). Data for this last category were the same as those reported in a previous study (Vu et al., 1998).
Figure 7.
Figure 7.
Effects of unilateral stimulation within RA during song. A, Percentage of songs with syllable-level effects resulting from RA stimulation. On the left, the percentage of syllable-level effects combined from both dorsal and ventral RA stimulation is shown for four different current intensities. On the right, syllable-level effects at 45 μA are compared between the dorsal and ventral regions of RA. B, Percentage of song-level effects resulting from RA stimulation. On the left, effects from ventral and dorsal stimulation are combined. On the right, song-level effects are shown separately for 45μA stimulation in the dorsal and ventral regions of RA. All categories are compared with percentages collected from a control set of songs (CONT) with no stimulation (*p < 0.001, G test).
Figure 8.
Figure 8.
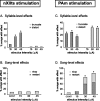
Effects of unilateral stimulation within nXIIts (left panels) and PAm (right panels) during song. nXIIts stimulation (A, B). A, Syllable-level effects. Stimulation in this structure caused significant distortion of the ongoing syllable (dark gray) without any significant syllable truncation (light gray). B, Song-level effects. Stimulation in nXIIts did not cause any significant amount of song stops (light gray) or motif restarts (dark gray). PAm stimulation (C, D). C, Syllable-level effects. Stimulation in PAm caused both truncation of the ongoing syllables (light gray) and acoustic or spectral distortion of the stimulated syllable (dark gray). D, Song-level effects. In contrast to nXIIts, stimulation in PAm caused a significant number of song stops (light gray) and motif restarts at 30 and 45 μA (dark gray). Syllable-level effects are shown for three different current levels (A, C) and are compared with a control set (data not shown). In the song-level graphs (B, D), the control set of songs with no stimulation is labeled CONT (*p<0.001, G test).
Figure 9.
Figure 9.
Changes in acoustic amplitude pattern are not sufficient to cause song-level effects. A, Amplitude envelope of an unstimulated control syllable. The top panel represents a motif from an unstimulated control song shown as an amplitude waveform. In the bottom half of the panel, a representative syllable (syllable C, solid line) has been rectified and smoothed. It is overlaid over the mean envelope of that same syllable (dotted line) to show the stereotyped nature of the acoustic envelope of unstimulated syllables. B, Biphasic change in acoustic amplitude pattern after PAm stimulation leading to syllable truncation. Stimulation (indicated by vertical arrow) in PAm often caused a rapid and temporary decrease (highlighted in gray) in the acoustic amplitude of the stimulated syllable (solid line). As shown in this example, this was sometimes followed by a temporary increase in amplitude of the syllable acoustic envelope. The temporary suppression preceded syllable truncation, which is exemplified by a second and final decrease of acoustic amplitude to baseline levels. Syllable truncation was then followed by a song-level effect (restart). This biphasic change in acoustic pattern after PAm stimulation was not observed in the other structures that were stimulated. The average envelope of the unstimulated control syllable C is shown as a dotted line. C, Biphasic change in acoustic amplitude pattern that does not lead to song-level effects. In this example, stimulation caused a temporary suppression (highlighted in gray) of the acoustic envelope of syllable C without any ensuing song-level effect. All examples in A–C were for the same syllable in different songs in the same bird. Current intensity of PAm stimulation was 45μA in both B and C. D, Relationship between acoustic amplitude changes and song-level effects. In half (27 of 54) of the instances of temporary suppression, song-level effects (song stop and motif restart) followed. In the rest (27 of 54), no song-level effects were seen.

References

    1. Ashmore RC, Wild JM, Schmidt MF (2004) The role of brainstem respiratory-vocal nuclei in the generation of vocal-motor sequences. Soc Neurosci Abstr 30: 786.16.
    1. Cardin JA, Raksin JN, Schmidt MF (2005) Sensorimotor nucleus NIf is necessary for auditory processing but not vocal motor output in the avian song system. J Neurophysiol 93: 2157–2166. - PubMed
    1. Cohen AH, Guan L, Harris J, Jung R, Kiemel T (1996) Interaction between the caudal brainstem and the lamprey central pattern generator for locomotion. Neuroscience 74: 1161–1173. - PubMed
    1. Coleman MJ, Vu ET (2005) Recovery of impaired songs following unilateral but not bilateral lesions of nucleus uvaeformis of adult zebra finches. J Neurobiol 63: 70–89. - PubMed
    1. Cynx J (1990) Experimental determination of a unit of song production in the zebra finch (Taeniopygia guttata). J Comp Psychol 104: 3–10. - PubMed

Publication types

LinkOut - more resources