. 2005 Sep 15;437(7057):412-6.
doi: 10.1038/nature03961.

A sensory source for motor variation

Affiliations

A sensory source for motor variation

Leslie C Osborne et al. Nature. .

Abstract

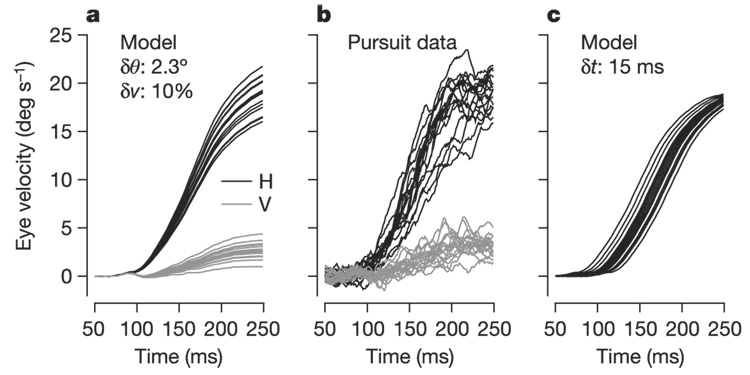
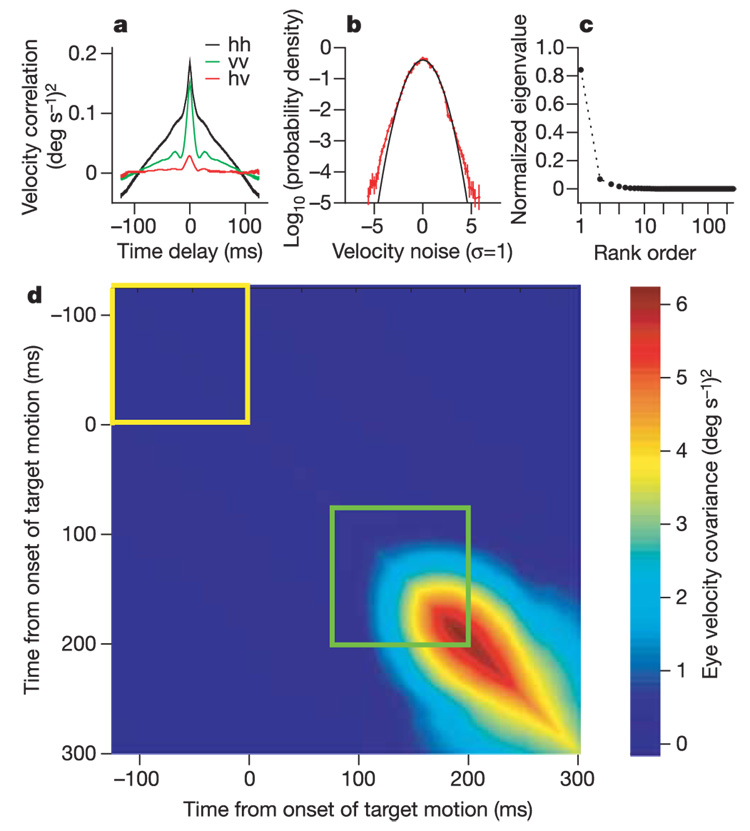
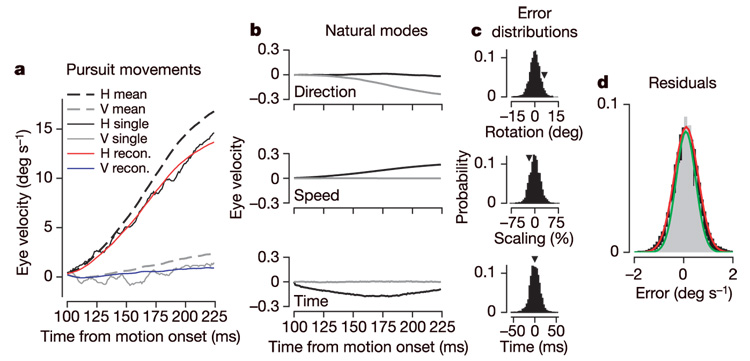
Suppose that the variability in our movements is caused not by noise in the motor system itself, nor by fluctuations in our intentions or plans, but rather by errors in our sensory estimates of the external parameters that define the appropriate action. For tasks in which precision is at a premium, performance would be optimal if no noise were added in movement planning and execution: motor output would be as accurate as possible given the quality of sensory inputs. Here we use visually guided smooth-pursuit eye movements in primates as a testing ground for this notion of optimality. In response to repeated presentations of identical target motions, nearly 92% of the variance in eye trajectory can be accounted for as a consequence of errors in sensory estimates of the speed, direction and timing of target motion, plus a small background noise that is observed both during eye movements and during fixations. The magnitudes of the inferred sensory errors agree with the observed thresholds for sensory discrimination by perceptual systems, suggesting that the very different neural processes of perception and action are limited by the same sources of noise.


Figures

Figure 1
Figure 1. Example of the variability in pursuit for a given target motion
a, Model data created from the mean pursuit-velocity time course, averaged over 184 repetitions of the same target motion. For each trace, the mean trajectory was rotated and scaled by a gaussian distributed ‘noise’ value, the standard deviation of which matches perceptual discrimination threshold values for direction and speed in human subjects (2.3° and 10%). b, Actual data showing 18 individual pursuit trials. c, Model data created by taking the same mean pursuit trajectory and jittering its start time by a gaussian distributed shift value with a standard deviation of 15 ms. Black and grey lines in a and b distinguish the horizontal (H) and vertical (V) components of eye velocity; only horizontal eye velocity is shown in c. Time is measured relative to target motion onset.
Figure 2
Figure 2. Analysis of variation in pursuit trajectory for a single day’s experiment
a, Temporal structure of correlation in eye-velocity variations before the onset of pursuit. Colours in key and traces labelled hh, vv and hv compare horizontal or vertical eye velocity to themselves or to each other (hv). b, Logarithm of probability density (red) and the best-fitting Gaussian curve (black) for the variations in eye velocity (in units of standard deviation, σ) before the onset of target motion. Error bars are s.d. divided by the mean. c, Rank order of the 250 normalized eigenvalues for ΔC. Standard deviations are smaller than the size of the symbols. d, Covariance matrix showing how the variation in horizontal eye velocity at any given time was related to that at all other times.
Figure 3
Figure 3. Reconstruction of individual pursuit trials from the model described by equation (1)
a, Eye velocity as a function of time for the mean trajectory, and for the actual and reconstructed trajectory for a single trial. b, Time courses of the sensory noise modes (vdir, vspeed, vtime) in units of eye velocity per equivalent sensory error. c, Distributions of δθ, δν and δt0 for 184 responses to the same target trajectory. Arrowheads indicate the values of the errors used to reconstruct the single trial in a. d, Distributions of difference between actual and predicted eye velocity during pursuit (black) and the total noise present during fixation (grey), along with best-fitting gaussian functions (red, green).

References

    1. Fitts PM. The information capacity of the human motor system in controlling the amplitude of movement. J. Exp. Psychol. 1954;47:381–391. reprinted in. J. Exp. Psychol. 121, 262--269 (1992) - PubMed
    1. Gordon J, Ghilardi MF, Ghez C. Accuracy of planar reaching movements. I. Independence of direction and extent variability. Exp. Brain Res. 1994;99:97–111. - PubMed
    1. Messier J, Kalaska JF. Comparison of variability of initial kinematics and endpoints of reaching movements. Exp. Brain Res. 1999;125:129–152. - PubMed
    1. Harris CM, Wolpert DM. Signal-dependent noise determines motor planning. Nature. 1998;394:780–784. - PubMed
    1. d'Avella A, Bizzi E. Low dimensionality of surpaspinally induced force fields. Proc. Natl Acad. Sci. USA. 1998;95:7711–7714. - PMC - PubMed

Publication types