

Cluster detection methods applied to the Upper Cape Cod cancer data
- PMID: 16164750
- PMCID: PMC1242352
- DOI: 10.1186/1476-069X-4-19
Cluster detection methods applied to the Upper Cape Cod cancer data
Abstract
Background: A variety of statistical methods have been suggested to assess the degree and/or the location of spatial clustering of disease cases. However, there is relatively little in the literature devoted to comparison and critique of different methods. Most of the available comparative studies rely on simulated data rather than real data sets.
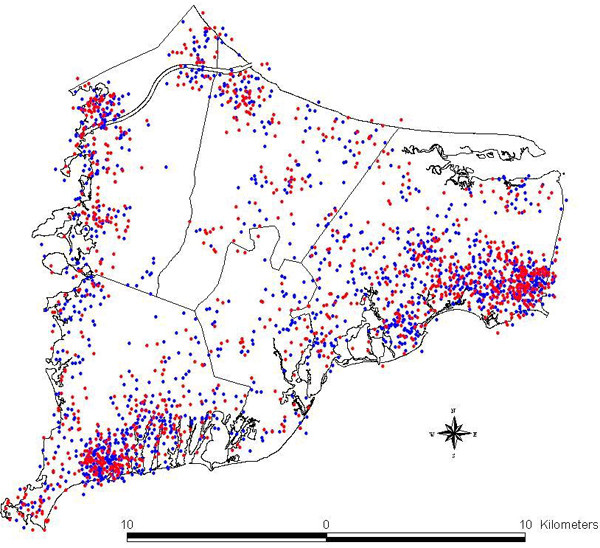
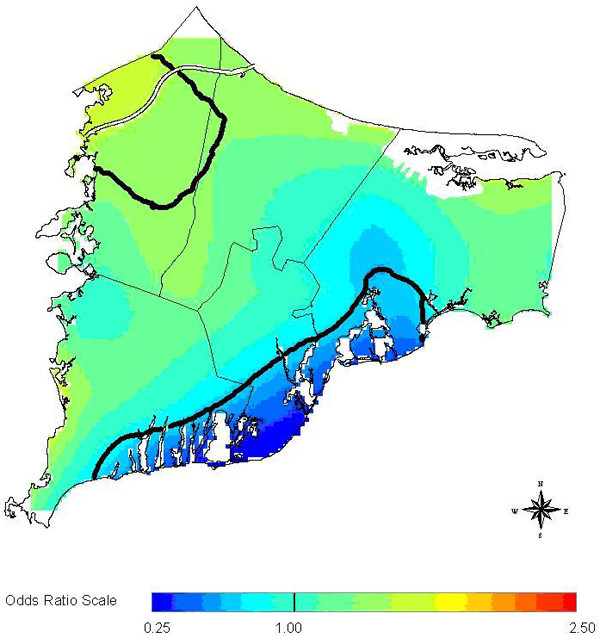
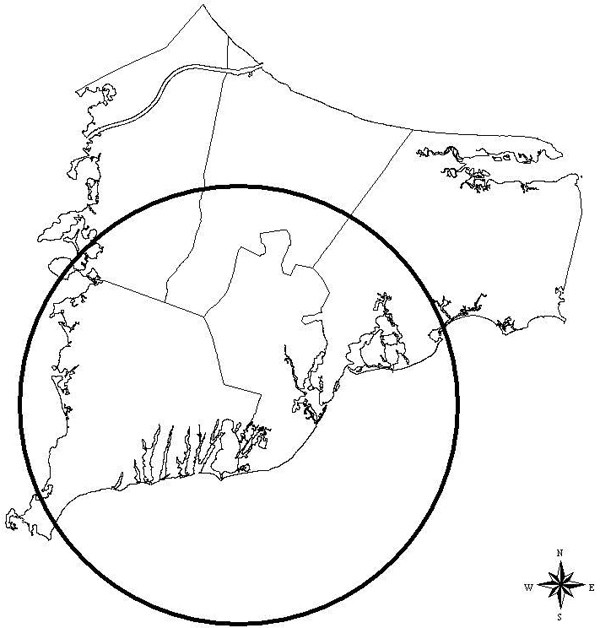
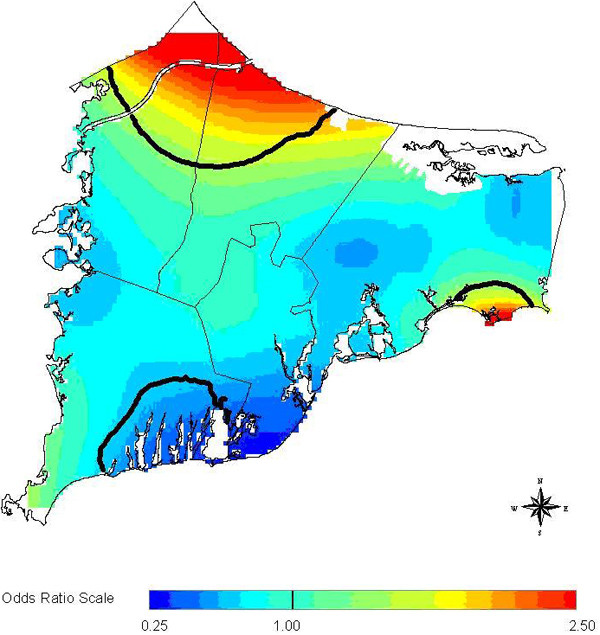
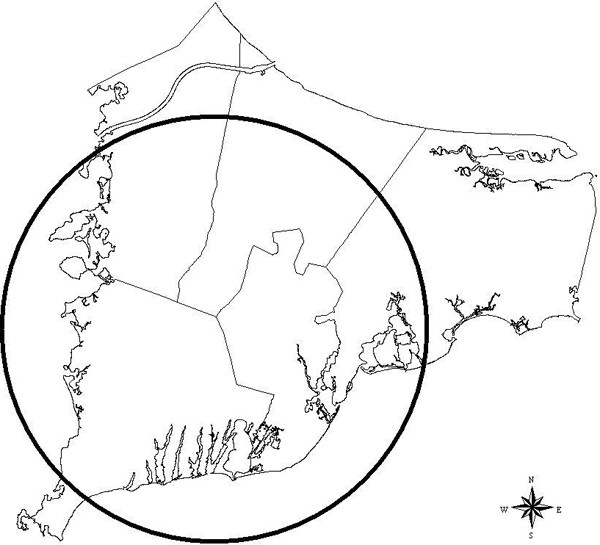
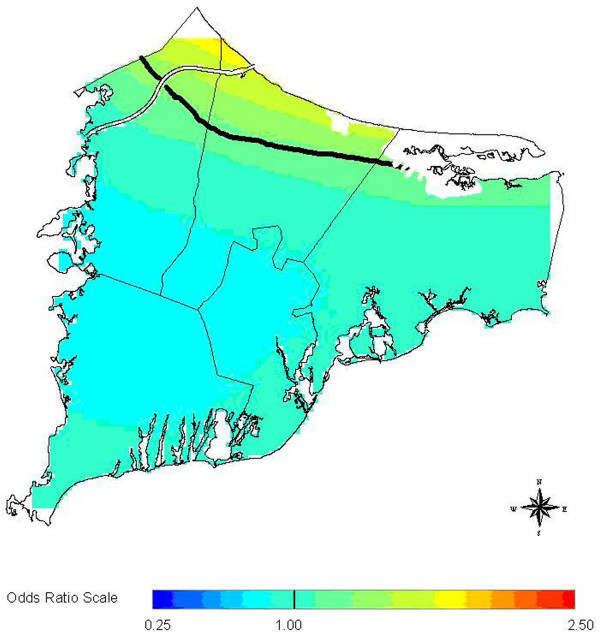
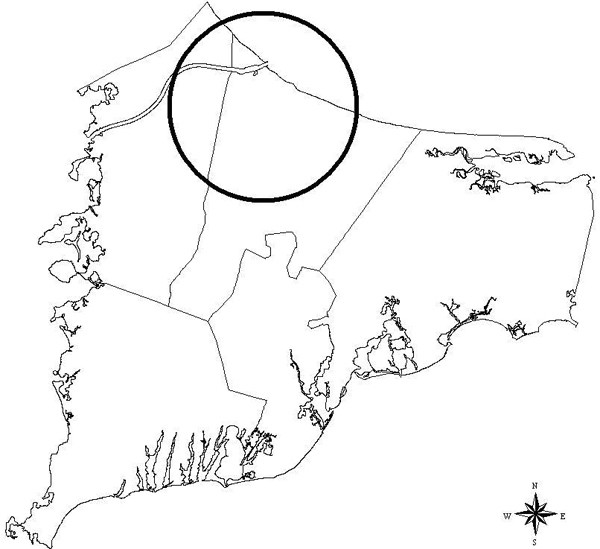
Methods: We have chosen three methods currently used for examining spatial disease patterns: the M-statistic of Bonetti and Pagano; the Generalized Additive Model (GAM) method as applied by Webster; and Kulldorff's spatial scan statistic. We apply these statistics to analyze breast cancer data from the Upper Cape Cancer Incidence Study using three different latency assumptions.
Results: The three different latency assumptions produced three different spatial patterns of cases and controls. For 20 year latency, all three methods generally concur. However, for 15 year latency and no latency assumptions, the methods produce different results when testing for global clustering.
Conclusion: The comparative analyses of real data sets by different statistical methods provides insight into directions for further research. We suggest a research program designed around examining real data sets to guide focused investigation of relevant features using simulated data, for the purpose of understanding how to interpret statistical methods applied to epidemiological data with a spatial component.
Figures
References
-
- Lawson A, Biggeri A, Böhning D, Lesaffre E, Viel JF, Bertollini R. Disease Mapping and Risk Assessment for Public Health. Wiley; 1999.
-
- Forsberg L. A review of clustering literature for public health. [Preprint]
-
- Kulldorff M, Tango T, Park PJ. Power comparisons for disease clustering tests. Comp Stat Data Anal. 2003;42:665–684. doi: 10.1016/S0167-9473(02)00160-3. - DOI
-
- Ozonoff A, Bonetti M, Forsberg L, Pagano M. Power comparisons for an improved disease clustering test. Comp Stat Data Anal. 2005;48:679–684. doi: 10.1016/j.csda.2004.03.012. - DOI
-
- Bonetti M, Pagano M. The interpoint distance distribution as a descriptor of point patterns: An application to cluster detection. Stat Med. - PubMed
Publication types
MeSH terms
Grants and funding
LinkOut - more resources
Full Text Sources
Medical
