. 2005 Nov 15;569(Pt 1):257-74.
doi: 10.1113/jphysiol.2005.097014. Epub 2005 Sep 15.

Spike coding during osmotic stimulation of the rat supraoptic nucleus

Affiliations

Spike coding during osmotic stimulation of the rat supraoptic nucleus

G S Bhumbra et al. J Physiol. .

Abstract

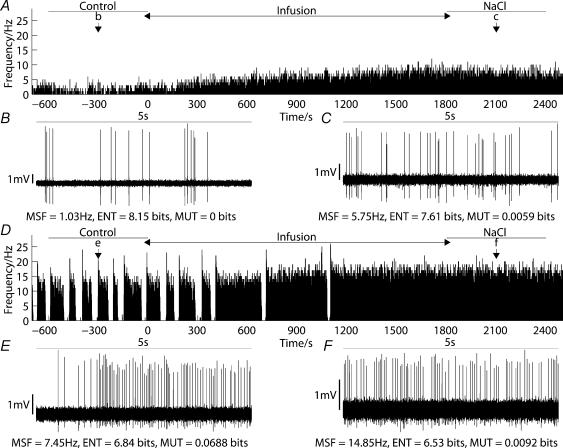
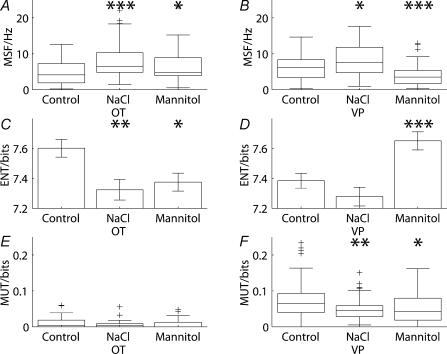
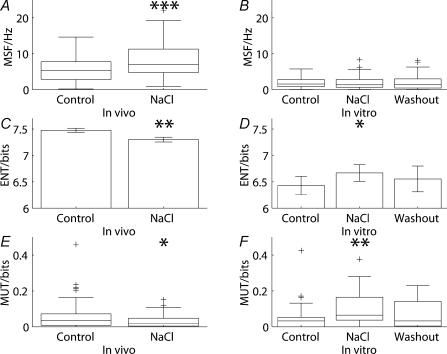
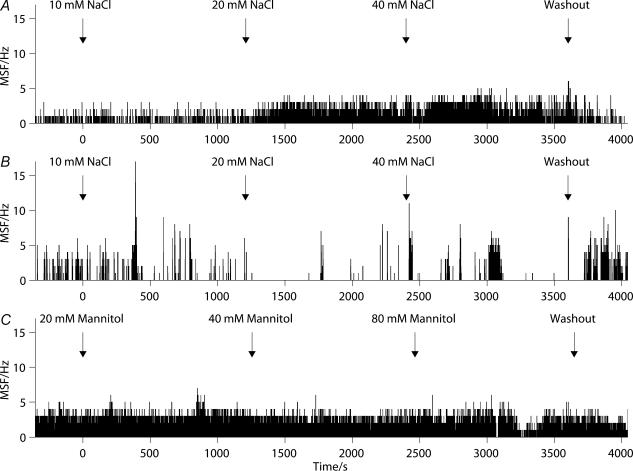
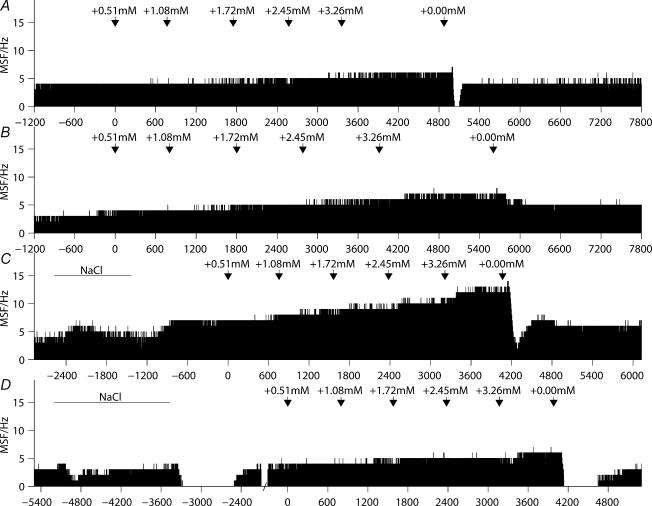
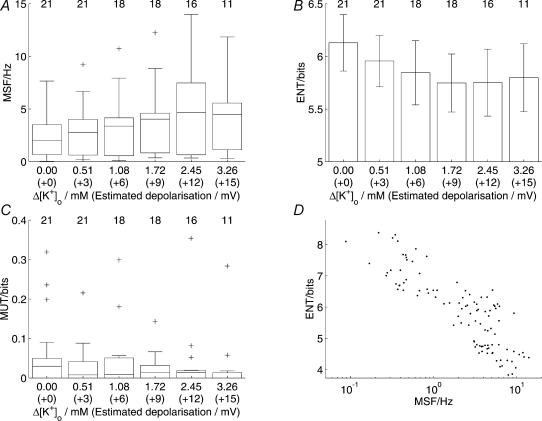
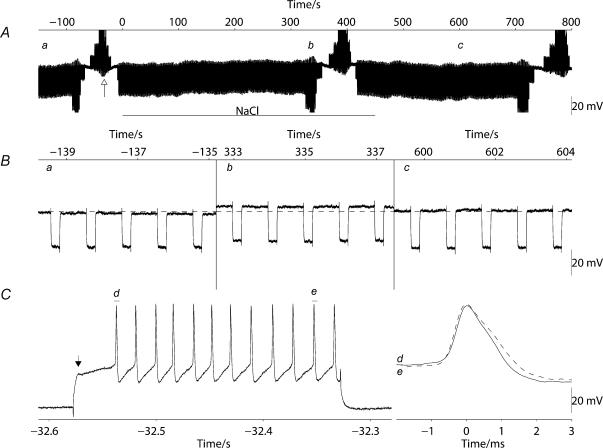
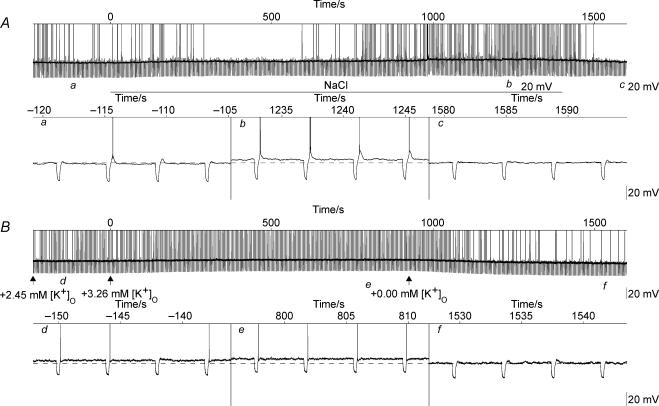
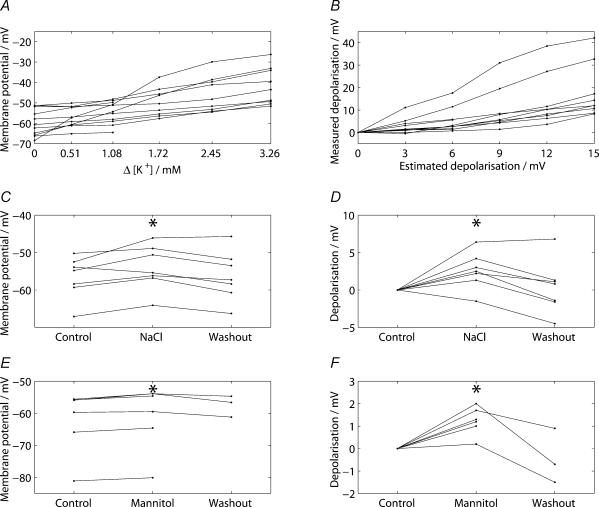
Novel measures of coding based on interspike intervals were used to characterize the responses of supraoptic cells to osmotic stimulation. Infusion of hypertonic NaCl in vivo increased the firing rate of continuous (putative oxytocin) cells (Wilcoxon z= 3.84, P= 0.001) and phasic (putative vasopressin) cells (z= 2.14, P= 0.032). The irregularity of activity, quantified by the log interval entropy, was decreased for continuous (Student's t= 3.06, P= 0.003) but not phasic cells (t= 1.34, P= 0.181). For continuous cells, the increase in frequency and decrease in entropy was significantly greater (t= 2.61, P= 0.036 and t= 3.06, P= 0.007, respectively) than for phasic cells. Spike patterning, quantified using the mutual information between intervals, was decreased for phasic (z=-2.64, P= 0.008) but not continuous cells (z=-1.14, P= 0.256). Although continuous cells showed similar osmotic responses to mannitol infusion, phasic cells showed differences: spike frequency decreased (z=-3.70, P < 0.001) and entropy increased (t=-3.41, P < 0.001). Considering both cell types together, osmotic stimulation in vitro using 40 mm NaCl had little effect on firing rate (z=-0.319, P= 0.750), but increased both entropy (t= 2.75, P= 0.010) and mutual information (z=-2.73, P= 0.006) in contrast to the decreases (t= 2.92, P= 0.004 and z=-2.40, P= 0.017) seen in vivo. Responses to less severe osmotic stimulation with NaCl or mannitol were not significant. Potassium-induced depolarization in vitro increased firing rate (r= 0.195, P= 0.034), but the correlation with decreased entropy was not significant (r=-0.097, P= 0.412). Intracellular recordings showed a small depolarization and decrease in input resistance during osmotic stimulation with NaCl or mannitol, and membrane depolarization following addition of potassium. Differences in responses of oxytocin and vasopressin cells in vivo, suggest differences in the balance between the synaptic and membrane properties involved in coding their osmotic responses. The osmotic responses in vivo constrasted with those seen in vitro, which suggests that, in vivo, they depend on extrinsic circuitry. Differences in responses to osmolality and direct depolarization in vitro indicate that the mechanism of osmoresponsiveness within a physiological range is unlikely to be fully explained by depolarization.


Figures

Figure 1
Figure 1. Continuous and phasic cells respond differently to osmotic stimulation in vivo
A, shows a ratemeter record, with a 1-s bin width, of a continuous cell during a 30-min infusion of 1 m NaCl at a rate of 52 μl min−1. B and C, show 5-s excerpts taken from A at the times indicated, before (Control) and after (NaCl) hypertonic infusion. Values for mean spike frequency (MSF), log interval entropy (ENT) and mutual information (MUT) are included. Although the firing rate for the continuous cell was greater in C than B, the interval variability was smaller. DF, show equivalent plots for a phasic cell recorded before, during and after a similar infusion, illustrating an increase in mean spike frequency, a small decrease in entropy and a substantial decrease in mutual information.
Figure 2
Figure 2. While both continuous and phasic cells respond to osmotic stimulation in vivo, the responses of phasic cells were highly variable
A, illustrates a ratemeter record that shows that an infusion of hypertonic saline increased the mean spike frequency (MSF) of a single representative continuous cell. BF, the phasic cell responses show a clear increase in firing rate, but other individual cells showed either very little response (GJ) or inhibition (K and L) during the infusion of hypertonic saline, and a very similar rate after the infusion as before it. ‘Infusion’ marks in the time of the 30-min infusion of 1 m NaCl.
Figure 3
Figure 3. Continuous and phasic cells show differences in their responses to osmotic stimulation in vivo
Before the hypertonic infusion of NaCl, 50 continuous cells and 68 phasic cells were recorded, whereas 48 continuous cells and 51 phasic cells were recorded after the infusion. Where the distributions passed the normality test, means ±s.e.m. are represented; otherwise box and whiskers plots are shown (a box and whiskers plot represents the median as a single line with a box to indicate the interquartile range; the whiskers represent the furthest data values within one and a half times the interquartile range away from the lower and upper quartile, and outliers are marked as crosses). Continuous (A) cells showed an obvious increase in mean spike frequency following NaCl infusion (z = 3.84, P < 0.001). The increase in firing rate of phasic (B) cells was significant (z = 2.14, P = 0.032) but at a lower level. Osmotic stimulation with NaCl significantly reduced the log interval entropy of continuous (C) cells (t = 3.06, P = 0.003) but not phasic (D) cells (t = 1.34, P = 0.181). For phasic (F) cells, NaCl significantly decreased the mutual information (z = −2.64, P = 0.008), but did not do so for continuous (E) cells (z = −1.14, P = 0.256). Osmotic stimulation with mannitol was tested in 39 continuous cells and 53 phasic cells. The effects of mannitol infusion on continuous cells were similar to those of NaCl. Mannitol infusion was associated with an increase (A) in firing rate (z = 2.21, P = 0.027), a decrease in (C) entropy (t = 2.64, P = 0.009) and had little effect (E) on mutual information (z = −0.816, P = 0.415). The responses of phasic cells to mannitol were different from those following sodium infusion. Mannitol infusion was associated with a decrease (B) in firing rate (z = −3.70, P < 0.001), an increase (D) in entropy (t = −3.41, P < 0.001) and a decrease (F) in mutual information (z = −2.10, P = 0.036).
Figure 4
Figure 4. Osmotic stimulation by increasing the NaCl concentration in the aCSF by 40 mM had no consistent effect on mean spike frequency of supraoptic cells recorded in vitro
AE, represents a ratemeter trace recorded before, during and after osmotic stimulation. The hypertonic solution was applied during the period indicated by ‘NaCl’. Osmotic stimulation in vitro resulted in both increases (A and D) and decreases (B and E) in mean spike frequency, and some cells (C) showed changes in firing pattern.
Figure 5
Figure 5. Responses to osmotic stimulation in vivo differed from those seen in vitro
Before the hypertonic infusion of NaCl, 118 cells were recorded in vivo and 99 were recorded after the infusion whereas the number of cells tested in vitro was 30; no distinction was made between continuous and phasic cells. Where the distributions passed the normality test, means ±s.e.m. are represented; otherwise box and whiskers plots are shown. Osmotic stimulation in vivo significantly (z = 4.07, P < 0.001) increased (A) the mean spike frequency whereas the firing rate in vitro (B) was not significantly affected (z = −0.319, P = 0.750). The irregularity of activity, as measured by the log interval entropy, was decreased (C) in vivo (t = 2.92, P = 0.004) and increased (D) in vitro (t = 2.75, P = 0.010). Spike patterning, quantified using the mutual information between adjacent intervals, was decreased (E) in vivo (z = −2.40, P = 0.017) whereas the mutual information (F) in vitro was increased (z = −2.73, P = 0.006).
Figure 6
Figure 6. Graded osmotic stimulation of supraoptic neurones in vitro showed no consistent effect on firing rate
Three representative responses are illustrated showing activity, before, during and after the administration of NaCl (A and B) and mannitol (C). The responses were variable. The effects of osmotic stimulation on spike activity showed increases (A), decreases (B), and minimal changes (C) in firing rate.
Figure 7
Figure 7. Ratemeter records show that graded depolarization produced by progressive increases in extracellular potassium concentration increased the mean spike frequency of supraoptic cells in vitro but osmotic stimulation did not consistently increase firing rate
For the first cell (A), the washout initially silenced the cell before a rapid restoration to the original firing rate whereas the second cell (B) was not silenced by the washout but the firing rate showed a partial recovery. The cells represented in C and D were first tested by an increase in aCSF osmolality by the addition of 40 mm NaCl before depolarization. For the cell represented in C, both osmotic stimulation and depolarization increased the mean spike frequency whereas the cell represented in D showed little effect or even a reduction in mean spike frequency during the osmotic stimulation; during the washout periods following both osmotic stimulation and potassium-induced depolarization, the cell transiently ceased firing before a full recovery.
Figure 8
Figure 8. Depolarization in vitro was associated with a significant increase in firing rate but with little effect on spike irregularity or patterning
Altogether, 21 cells were tested in vitro for the effects of depolarization. Where the distributions passed the normality test, means ±s.e.m. are represented; otherwise box and whiskers plots are shown. Group numbers are represented at the top of each column. Increased depolarization was correlated with an increase in mean spike frequency (A, r = 0.195, P = 0.034) but not entropy (B, r = −0.097, P = 0.412) or mutual information (C, r = −0.180, P = 0.267). A scatter plot of entropy against mean spike frequency (D) showed a strong negative correlation (r = −0.854, P < 0.001).
Figure 9
Figure 9. Intracellular sharp electrode recordings from magnocellular supraoptic cells in vitro showed a slight depolarization and a decrease in membrane resistance during osmotic stimulation
A, shows a 15-min excerpt of a recording on a long time scale indicating the time during which osmolality was raised (‘NaCl’); the spikes have been truncated and hyperpolarizing current injections of −200 pA were applied for 250 ms every second. The cell was depolarized to a small degree (3 mV) by increasing the osmolality of the aCSF by raising sodium by 40 mm. Three 4-s excerpts taken from A at the times marked a, b and c, show in B that membrane resistance decreased at the same time as the membrane depolarized. To confirm that each recorded supraoptic cell was a magnocellular neurosecretory cell, injection of a positive current of 400 pA with a pulse width of 250 ms was applied (at the time indicated in A by the open arrow) to activate the potassium A current (seen as a ‘notch’ on the rising phase of the depolarization in C marked by the filled arrow) and spike broadening was observed during the rapid burst of spikes. Full replacement of the aCSF in the recording chamber was completed 100 s after the times indicated.
Figure 10
Figure 10. Whole-cell current-clamp recordings from magnocellular supraoptic cells in vitro showed that the addition of both sodium and potassium depolarized the membrane
A, shows a 30-min excerpt of a recording on a long time scale indicating the time during which osmolality was raised (‘NaCl’); the spikes have been truncated and current injections of −15 pA were applied for 250 ms every 4 s. Three 16-s excerpts taken from A at the times marked a, b and c are illustrated in the expanded panels to show that the cell was depolarized to a small degree (3 mV) by increasing the osmolality of the aCSF by raising sodium by 40 mm. B, shows a 30-min excerpt of a recording from the same cell showing the periods during which the potassium concentration was increased by the amounts indicated. The excerpts taken from B at the times marked d, e, and f show that each increment of potassium caused a progressive depolarization, with the last increment showing a depolarizing change in membrane potential comparable to that seen during the hypertonic infusion (3 mV). During the washout period, following the last increment (+ 3.28 mm), there was a partial recovery reflected by a decrease in membrane potential of 7 mV. Full replacement of the aCSF in the recording chamber was completed 100 s after the times indicated.
Figure 11
Figure 11. Grouped data for the whole-cell recordings from magnocellular supraoptic cells in vitro showed that the addition of sodium (40 mM), potassium (0.51–3.26 mM) and mannitol (80 mM) produced a significant depolarization
A, shows a graph of the membrane potential against the increase in potassium concentration for the 11 cells and B, shows a graph of the change in membrane potential against the estimated depolarization. The distribution of the data (n = 60) showed a strong positive correlation (r = 0.682, P < 0.001). C, illustrates the changes in membrane for seven cells before (‘Control’), during (‘NaCl’) and following (‘Washout’) osmotic stimulation by the addition of 40 mm NaCl to the aCSF and D, shows the extent of depolarization under the three conditions. The membrane was significantly depolarized during osmotic stimulation by NaCl when compared to the control period (t = −2.80, P = 0.031). For the cells tested during osmotic stimulation with mannitol (n = 6), there was a significant depolarization compared to the control period (1.2 ± 0.3 mV; t = 4.86, P = 0.005, paired t test). The difference, although smaller than the depolarization in response to NaCl, was not significant (t = 1.31, P = 0.216).

Similar articles

Cited by

References

    1. Andrew RD, Dudek FE. Analysis of intracellularly recorded phasic bursting by mammalian neuroendocrine cells. J Neurophysiol. 1984;51:552–566. - PubMed
    1. Bhumbra GS, Dyball REJ. Measuring spike coding in the supraoptic nucleus. J Physiol. 2004;555:281–296. - PMC - PubMed
    1. Bhumbra GS, Dyball REJ. Spike coding from the perspective of a neurone. Cogn Processing. 2005;6:157–176. - PubMed
    1. Bhumbra GS, Inyushkin AN, Dyball REJ. Assessment of spike activity in the supraoptic nucleus. J Neuroendocrinol. 2004;16:390–397. - PubMed
    1. Bhumbra GS, Inyushkin AN, Saeb-Parsy K, Hon A, Dyball REJ. Rhythmic changes in spike coding in the rat suprachiasmatic nucleus. J Physiol. 2005;563:291–307. - PMC - PubMed

Publication types