. 2005 Nov 15;569(Pt 1):163-78.
doi: 10.1113/jphysiol.2005.094805. Epub 2005 Sep 15.

Long-term in vivo modulation of synaptic efficacy at the neuromuscular junction of Rana pipiens frogs

Affiliations

Long-term in vivo modulation of synaptic efficacy at the neuromuscular junction of Rana pipiens frogs

Eve-Lyne Bélair et al. J Physiol. .

Abstract

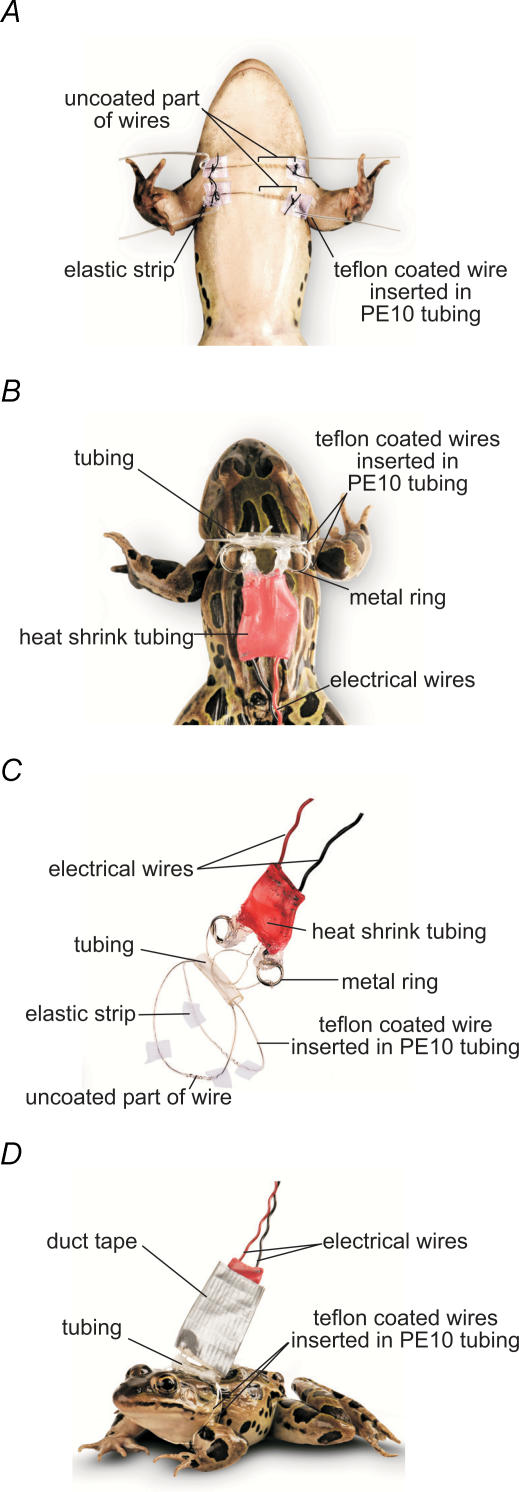
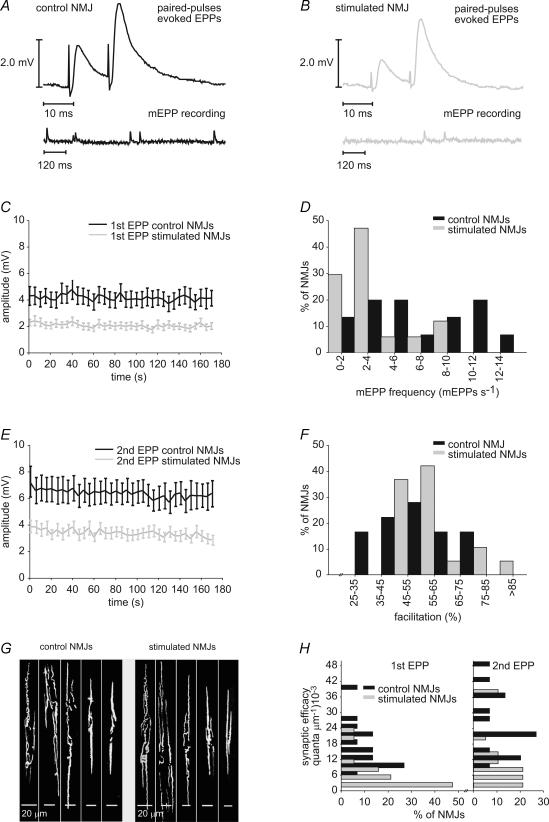
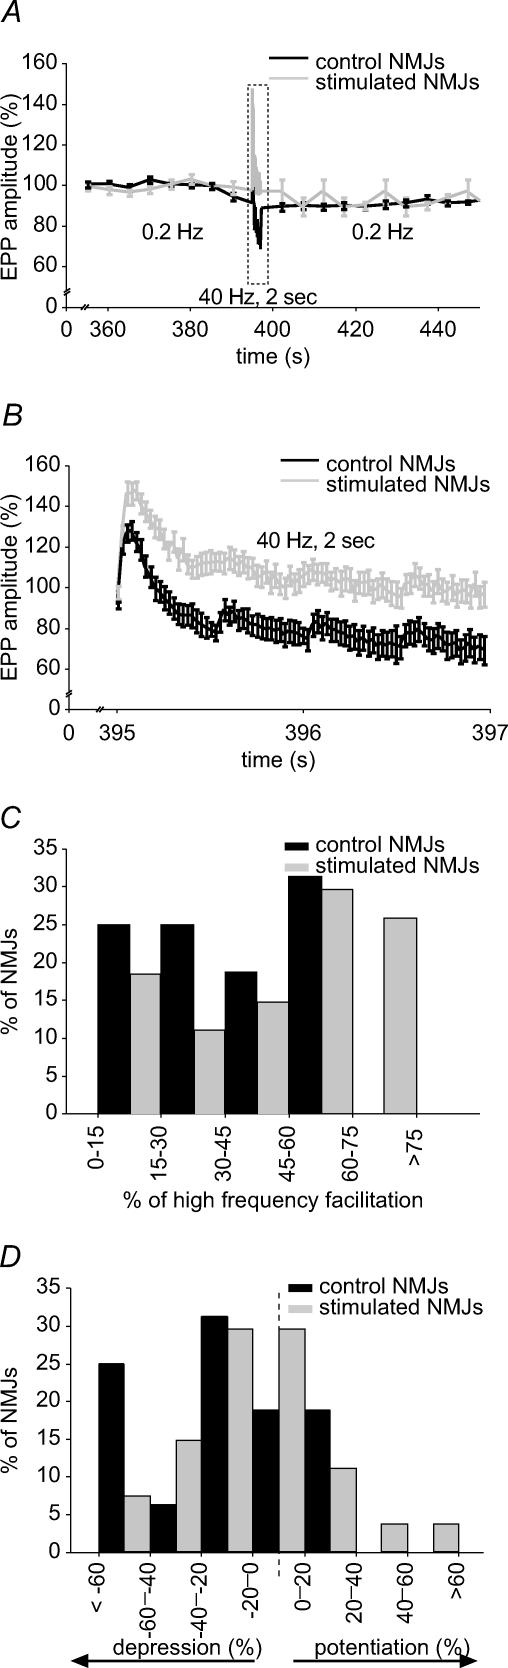
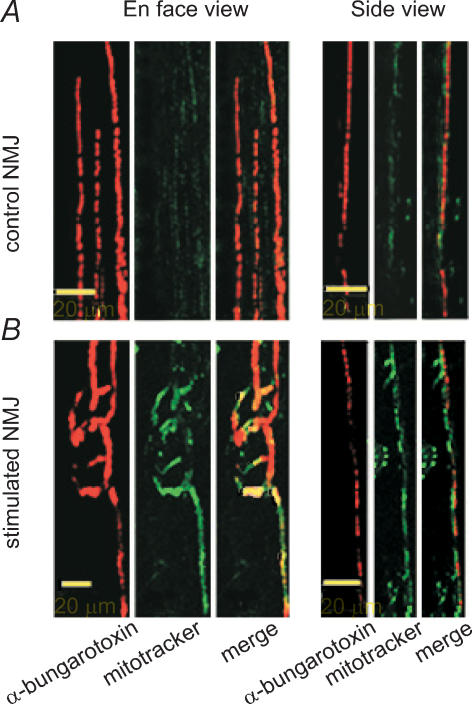
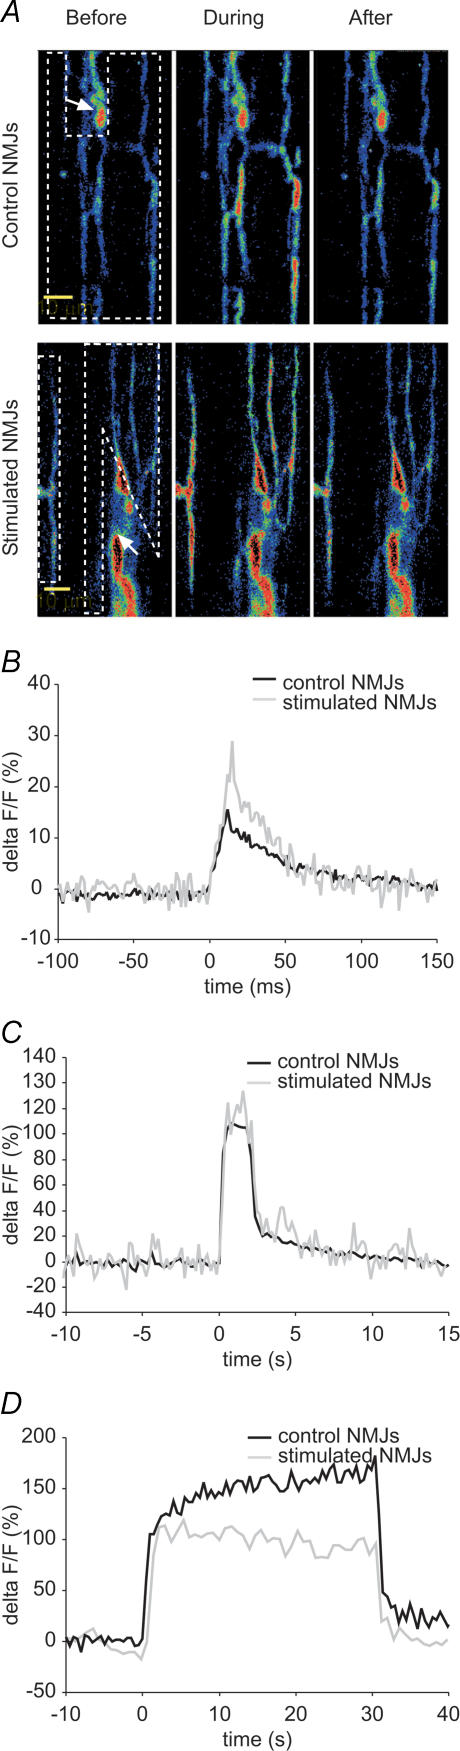
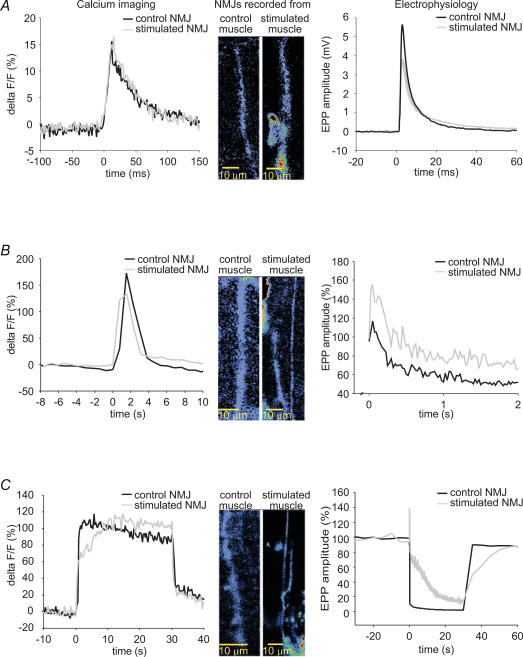
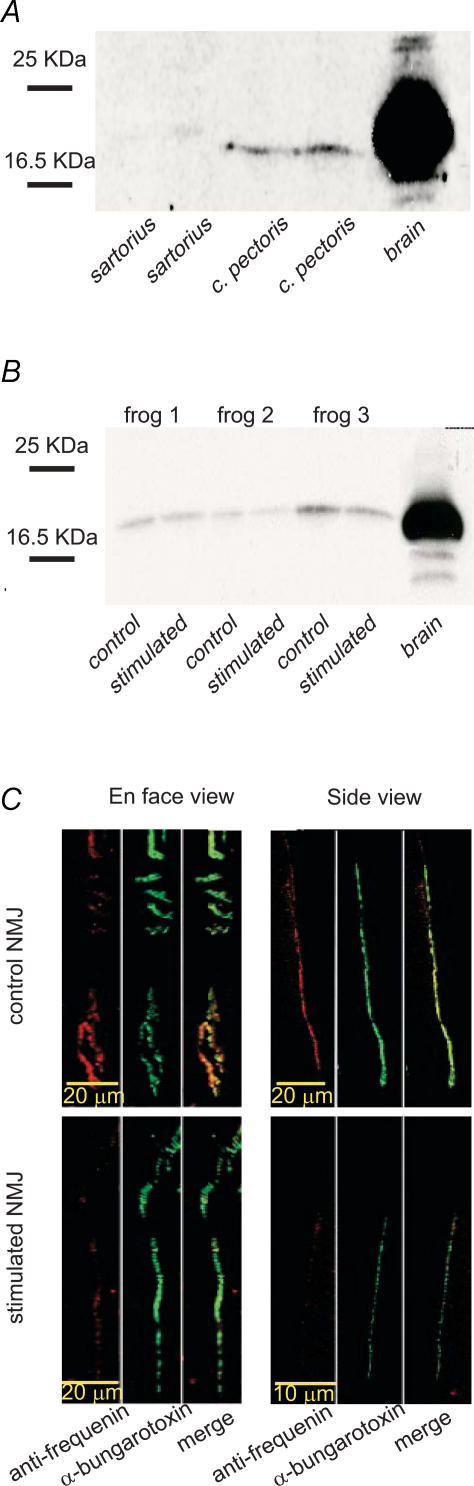
Prolonged changes in motor neurone activity can result in long-term changes in synaptic transmission. We investigated whether mechanisms commonly thought to be involved in determining synaptic efficacy of vertebrate motor neurones are involved in these long-term changes. The nerve supplying the cutaneous pectoris muscle was chronically stimulated via skin surface electrodes in freely moving frogs for 5-7 days. Chronic stimulation induced a 50% reduction in evoked endplate potential (EPP) amplitude at stimulated neuromuscular junctions (NMJs). These changes appear to be presynaptic since miniature EPP (mEPP) amplitude was unchanged while mEPP frequency was decreased by 46% and paired-pulse facilitation was increased by 26%. High frequency facilitation (40 Hz, 2 s) was also increased by 89%. Moreover, stimulated NMJs presented a 92% decrease in synaptic depression (40 Hz, 2 s). An increase in mitochondrial metabolism was observed as indicated by a more pronounced labelling of active mitochondria (Mitotracker) in stimulated nerve terminals, which could account for their greater resistance to synaptic depression. NMJ length visualized by alpha-bungarotoxin staining of nAChRs was not affected. Presynaptic calcium signals measured with Calcium Green-1 were larger in stimulated NMJs at low frequency (0.2 Hz) and not different from control NMJs at higher frequency (40 Hz, 2 s and 30 s). These results suggest that some mechanisms downstream of calcium entry are responsible for the determination of synaptic output, such as a down-regulation of some calcium-binding proteins, which could explain the observed results. The possibility of a change in frequenin expression, a calcium-binding protein that is more prominently expressed in phasic synapses, was, however, refuted by our results.


Figures

Figure 1
Figure 1. Stimulating electrodes for chronic long-term conditioning in vivo
A, ventral view. The two stimulating electrodes were placed parallel over the skin so that the pectoralis proprius nerve leading to the CP muscle lay between the uncoated section of the two Teflon coated wires. B, dorsal view. Electrode extremities were inserted into PE tubing, fixed on the dorsolateral folds, and connected to the stimulator. C, stimulation harness. It consists of a two-wire electrode inserted into tubing and attached to electrical wires via two metal rings. D, a freely moving frog with harness.
Figure 2
Figure 2. Effects of stimulation on the probability of transmitter release
A, representative electrophysiological recordings of mEPPs (bottom) and EPPs evoked by paired-pulse stimulation (top) in control (B) and stimulated NMJs. C, mean amplitude of the first EPP evoked by paired-pulse stimulation in control (black) and stimulated (grey) NMJs. Mean amplitude of EPPs was reduced in stimulated NMJs (P < 0.001, Student's t test; n = 9 frogs, n = 26 stimulated NMJs, 26 control NMJs). D, frequency histogram depicting the distribution of mEPP frequency in control (black) and stimulated (grey) NMJs. MEPP frequency of stimulated NMJs was shifted toward smaller values (P = 0.015, Student's t test) (n = 6 frogs, n = 19 stimulated NMJs, 18 control NMJs). E, mean amplitude of the second EPP evoked by paired-pulse stimulation in control (black) and stimulated (grey) NMJs. Mean amplitude of EPPs was reduced in stimulated NMJs (P < 0.001, Student's t test; n = 9 frogs, n = 26 stimulated NMJs, 26 control NMJs). F, frequency histogram depicting the distribution of paired-pulse facilitation in control (black) and stimulated (grey) NMJs. Paired-pulse facilitation of stimulated NMJs was shifted toward greater values (P = 0.032, Student's t test; n = 9 frogs, n = 26 stimulated NMJs, 26 control NMJs). G, postsynaptic nicotinic AChRs labelled with α-bungarotoxin coupled to Texas Red, showing the configuration of nerve terminals in control and stimulated CP muscles. Both muscle groups had nerve terminal morphology ranging from complex, with many branches, to very simple. No significant differences were found in NMJ length between control and stimulated NMJs (P = 0.420; Student's t test; n = 10 frogs, n = 152 stimulated NMJs, 123 control NMJs). H, frequency histogram depicting the distribution of synaptic efficacy (number of quanta of neurotransmitter per micrometre of NMJ length) in control (black) and stimulated (grey) NMJs. Synaptic efficacy of stimulated NMJs was shifted toward smaller values for first (P < 0.001; Mann-Whitney rank sum test) and second EPP (P = 0.002; Mann-Whitney rank sum test; N = 6 frogs, n = 19 stimulated NMJs, 15 control NMJs).
Figure 3
Figure 3. Effects of stimulation on short-term plasticity: high frequency facilitation and depression
A, mean EPP amplitude before, during and after high frequency stimulation (40 Hz, 2 s) for control (black) and stimulated (grey) NMJs. Mean amplitude is normalized to the mean EPP amplitude during the initial 0.2 Hz control period. B, enlarged view of the 40 Hz, 2 s stimulation period. On average, stimulated NMJs presented a greater facilitation at the beginning of the stimulation train and less depression at the end. C, frequency histogram depicting the distribution of high frequency facilitation at the beginning of the 40 Hz, 2 s stimulation train in control (black) and stimulated (grey) NMJs. High frequency facilitation of stimulated NMJs was shifted toward greater values (P < 0.001, Student's t test). D, frequency histogram depicting the distribution of depression/potentiation at the end of the 40 Hz, 2 s stimulation train in control (black) and stimulated (grey) NMJs. The distribution of stimulated NMJs is shifted toward potentiation (P = 0.003, Student's t test; n = 8 frogs, n = 27 stimulated NMJs, 16 control NMJs).
Figure 4
Figure 4. Effects of stimulation on mitochondria
Characteristic live staining of mitochondria in control (A), and stimulated NMJs (B), using a mitochondrion-selective dye (Mitotracker Red CM-H2XRos) that is concentrated by active mitochondria. The NMJs were visualized with Bodipy conjugated α-bungarotoxin to reveal the distribution of nAChRs. Merged images, in side view, revealed that Mitotracker staining was found directly above the nAChRs, in a pattern consistent with staining of the nerve terminal. Mitochondrial staining was increased in stimulated NMJs (P < 0.001, Mann-Whitney rank sum test; n = 4 frogs, n = 62 stimulated NMJs, 70 control NMJs).
Figure 5
Figure 5. Presynaptic calcium imaging
A, confocal images of representative loading of control and stimulated NMJs with the calcium indicator Calcium Green before, during and after stimulation. White dashed boxes surround regions of interest where calcium variations were measured, each box surrounds one NMJ. White arrows indicate myelinated nerve. B, characteristic presynaptic calcium response evoked by a 0.2 Hz stimulation in a control (black) and a stimulated (grey) NMJ. Mean calcium response of stimulated NMJs differed from control regarding amplitude (P = 0.004, Student's t test), mean slope of rise (P = 0.015, Student's t test), 100–20% decay slope (P = 0.047, Mann-Whitney rank sum test) and area under the curve (P = 0.005, Student's t test; n = 6 frogs, n = 13 stimulated NMJs, 12 control NMJs). C, representative presynaptic calcium response evoked by a 40 Hz, 2 s stimulation in a control (black) and a stimulated (grey) NMJ of a single frog. Mean calcium responses of stimulated NMJs were not statistically different from control in terms of amplitude (P = 0.430, Student's t test), mean slope of rise (P = 0.742, Mann-Whitney rank sum test), 100–20% decay slope (P = 0.667, Student's t test) and area under the curve (P = 0.063, Student's t test; n = 5 frogs, n = 27 stimulated NMJs, 27 control NMJs). D, representative presynaptic calcium response evoked by a 40 Hz, 30 s stimulation in a control (black) and a stimulated (grey) NMJ. Mean calcium responses were not statistically different from control regarding amplitude (P = 0.581, Mann-Whitney rank sum test), mean slope of rise (P = 0.756, Mann-Whitney rank sum test), mean slope during plateau (P = 0.559, Mann-Whitney rank sum test), 100–20% decay slope (P = 0.699, Mann-Whitney rank sum test) and area under the curve (P = 0.699, Mann-Whitney rank sum test; n = 8 frogs, n = 44 stimulated NMJs, 32 control NMJs).
Figure 6
Figure 6. Simultaneous presynaptic calcium imaging and recording of synaptic transmission
Examples of simultaneous recordings of presynaptic calcium responses and EPPs evoked by 0.2 Hz (A) 40 Hz, 2 s (B) and 40 Hz, 30 s (C) stimulation in control (black) and stimulated NMJs (grey). Differences in calcium responses cannot account for differences in electrophysiological properties.
Figure 7
Figure 7. Effect of stimulation on frequenin expression
A, Western blot showing the expression of frequenin in tonic sartorius and phasic CP frog muscles and in frog brain tissue. Frequenin protein was poorly expressed in sartorius muscle. B, Western blot showing the expression of frequenin in stimulated and control CP muscles of 3 frogs and in frog brain tissue. Frog 2 and 3 presented a decrease in frequenin expression in stimulated muscles whereas frog 1 showed no obvious difference between control and stimulated muscles. C, characteristic frequenin staining in control and stimulated NMJs. NMJs were visualized using Bodipy-conjugated α-bungarotoxin to reveal the distribution of nAChRs. The merged image in side view reveals that anti-frequenin staining is found directly above the nAChRs, in a pattern consistent with staining of the nerve terminal.

References

    1. Alnaes E, Rahamimoff R. On the role of mitochondria in transmitter release from motor nerve terminals. J Physiol. 1975;248:285–306. - PMC - PubMed
    1. Angleson JK, Betz WJ. Intraterminal Ca2+ and spontaneous transmitter release at the frog neuromuscular junction. J Neurophysiol. 2001;85:287–294. - PubMed
    1. Atwood HL. Organization and synaptic physiology of crustacean neuromuscular systems. Prog Neurobiol. 1976;7:291–391. - PubMed
    1. Augustine GJ, Charlton MP. Calcium dependence of presynaptic calcium current and post-synaptic response at the squid giant synapse. J Physiol. 1986;381:619–640. - PMC - PubMed
    1. Banner LR, Herrera AA. Differences in synaptic efficacy at neuromuscular junctions in frog twitch muscles. J Physiol. 1986;379:205–215. - PMC - PubMed

Publication types

MeSH terms

LinkOut - more resources