. 2005 Nov 15;569(Pt 1):229-41.
doi: 10.1113/jphysiol.2005.093518. Epub 2005 Sep 15.

Cochlear function in mice with only one copy of the prestin gene

Affiliations

Cochlear function in mice with only one copy of the prestin gene

M A Cheatham et al. J Physiol. .

Abstract

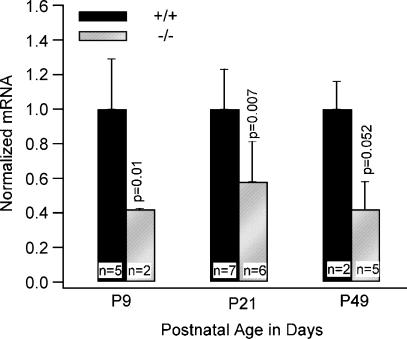
Targeted deletion of the prestin gene reduces cochlear sensitivity and eliminates both frequency selectivity and outer hair cell (OHC) somatic electromotility. In addition, it has been reported by Liberman and colleagues that F2 generation heterozygotes exhibit a 6 dB reduction in sensitivity, as well as a decrease in protein and electromotility. Considering that the active process is non-linear, a halving of somatic electromotility would be expected to produce a much larger change in sensitivity. We therefore re-evaluated comparisons between heterozygotes and wildtype mice using both in vivo and in vitro electrophysiology, as well as molecular biology. Data reported here for F3-F5 generation mice indicate that compound action potential thresholds and tuning curves, as well as the cochlear microphonic, are similar in heterozygotes and wildtype controls. Measurements of non-linear capacitance in isolated OHCs demonstrate that charge density, as well as the voltage dependence and sensitivity of motor function, is indistinguishable in the two genotypes, as is somatic electromotility. In addition, both immunocytochemistry and western blot analysis in young adult mice suggest that prestin protein in heterozygotes is near normal. In contrast, prestin mRNA is always less than in wildtype mice at all ages tested. Results from F3-F5 generation mice suggest that one copy of the prestin gene is capable of compensating for the deleted copy and that heterozygous mice do not suffer peripheral hearing impairment.


Figures

Figure 1
Figure 1. CAP thresholds
A, mean CAP thresholds for wildtype (○, broken lines) and heterozygous (▴, continuous lines) mice. The average age for wildtype mice was 51 days; that for heterozygotes, 47 days. B, the difference in CAP thresholds (continuous line). Standard deviations for heterozygotes are shown with error bars in the positive direction only; for wildtype mice, with the broken lines.
Figure 2
Figure 2. CAP tuning curves
A, average CAP tuning curves for wildtype (broken lines) and heterozygous (continuous lines) mice. Isolated symbols indicate the probe level, which was 53 dB for both genotypes. The average age for wildtype mice was 51 days; for heterozygotes, 48 days. As in Fig. 1, the difference between the tuning curves is given in B along with the standard deviations.
Figure 3
Figure 3. CM input–output functions
The top row provides CM data at 6, 12, 16 and 32 kHz. The average age for wildtype (heterozygous) mice was 49 (47) days. Plots at the bottom display the difference between CM input–output functions obtained in the two genotypes (continuous line). Standard deviations are represented as bars (broken lines) for heterozygous (wildtype) mice.
Figure 4
Figure 4. Non-linear capacitance
A, capacitance functions are provided for a representative wildtype control (broken lines) and a heterozygote (solid lines). Parameter fits to the data appear as thin continuous lines. The Qmax was 872.7 (702.1), α 29.4 (29.9), V½−66.3 (−69.6) and Clin 6.27 (5.7) for the wildtype mouse (heterozygote). B, normalized functions are provided for wildtype (broken line) and heterozygous (bold line) mice. The functions represent the derivatives of a first-order Boltzmann function, normalized to ClinAdj in the form: The two plots were obtained from the average values of the parameters (Qmax, α, V½ and ClinAdj) shown in Table 1. C, somatic electromotility. Video images of individual OHCs were used to obtain measures of somatic electromotility. The peak voltage-dependent length change was expressed as a percentage of each OHC's maximum length. The data were then normalized by giving the wildtype mean percentage change in length a value of 1.0 and then plotting the mean for heterozygotes relative to this value.
Figure 5
Figure 5. Immunofluorescence (IF)
A, both images were obtained 1.5 mm from the helicotrema in littermates at 21 days of age. The image at the top (bottom) is from a heterozygous (wildtype) mouse. B, results are shown for wildtype (filled bars) and heterozygous (shaded bars) mice killed at three weeks of age and for three groups of young adult mice. Data at ∼8 weeks were obtained from two litters: a litter of wildtype mice aged 7 weeks 5 days and a litter of heterozygotes aged 8 weeks 5 days. In all other cases, the data are collected from a single litter. The data are normalized by giving the average intensity/area for the wildtype mice in any given litter a value of 1.0. The average heterozygote intensity/area is then plotted relative to this value. Standard deviations appear as error bars.
Figure 6
Figure 6. Western blots
A, an example of the western blots used to quantify prestin protein expression in animals having one versus two copies of the prestin gene. The wildtype and heterozygous mice were from the same litter and were 21 days of age. The molecular mass of monomeric prestin was estimated based on a linear regression of the molecular mass ladder. No band appears for the knockout mouse shown on the left. B, the amount of prestin protein expressed at P9, P21 and P63. Regions of interest were drawn around each of the bands at ∼100 kDa. A similar region of interest was used to define the intensity of the background, which was then subtracted from each prestin-associated band. The measurements reflect the integrated intensity of the ∼100 kDa band measured relative to that of the background. In contrast to results at P9 and P21, only one cochlea was required to generate results at P63. As in Fig. 5B, the data are normalized to the mean wildtype intensity and standard deviations appear as error bars. The latter are absent for the P21 control because the litter contained only one wildtype mouse. *Protein levels are statistically different between heterozygous and wildtype mice but only at P9 (Student's t test, P < 0.01).
Figure 7
Figure 7. prestin mRNA
This figure provides prestin mRNA values for wildtype (filled bars) and heterozygous (shaded bars) mice obtained using real-time RT-PCR. Data are provided for litters at P9, P21 and P49. The values are normalized by plotting data from heterozygotes relative to the mean wildtype RNA level, which is given a value of 1.0. Standard deviations appear as error bars. The P values obtained using the Student's t test are also appended.

References

    1. Ashmore JF. A fast motile response in guinea-pig outer hair cells: The cellular basis of the cochlear amplifier. J Phyiol. 1987;388:323–347. - PMC - PubMed
    1. Ashmore JF. Forward and reverse transduction in the mammalian cochlea. Neurosci Res Suppl. 1990;12:S39–S50. - PubMed
    1. Belyantseva IA, Adler HJ, Curi R, Frolenkov GI, Kachar B. Expression and localization of Prestin and the sugar transporter GLUT-5 during development of electromotility in cochlear outer hair cells. J Neurosci. 2000;20:1–5. RC116. - PMC - PubMed
    1. Brownell WE, Bader CR, Bertrand D, Ribaupierre Y. Evoked mechanical responses of isolated outer hair cells. Science. 1985;227:194–196. - PubMed
    1. Bustin SA. Quantification of mRNA using real-time reverse transcription PCR (RT-PCR): trends and problems. J Mol Endocrinol. 2002;29:23–39. - PubMed

Publication types

LinkOut - more resources