. 2005 Nov 15;569(Pt 1):243-56.
doi: 10.1113/jphysiol.2005.091801. Epub 2005 Sep 15.

Sodium pump alpha2 subunits control myogenic tone and blood pressure in mice

Affiliations

Sodium pump alpha2 subunits control myogenic tone and blood pressure in mice

Jin Zhang et al. J Physiol. .

Abstract

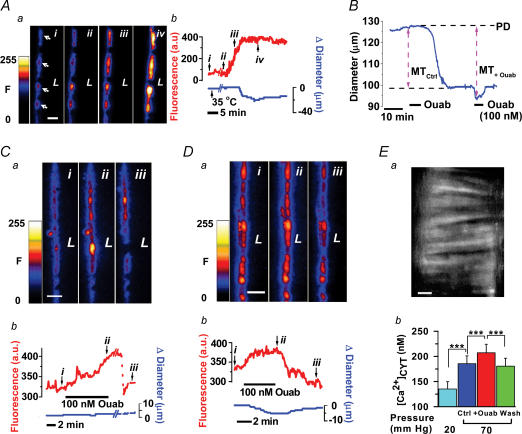
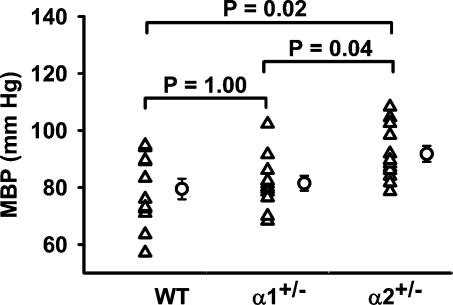
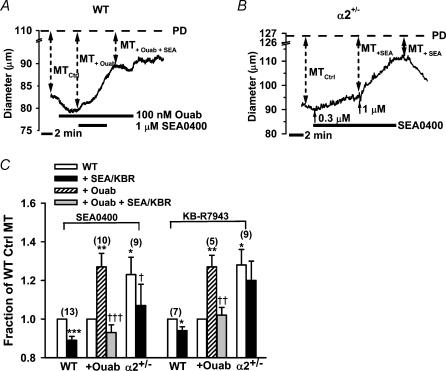
A key question in hypertension is: How is long-term blood pressure controlled? A clue is that chronic salt retention elevates an endogenous ouabain-like compound (EOLC) and induces salt-dependent hypertension mediated by Na(+)/Ca(2)(+) exchange (NCX). The precise mechanism, however, is unresolved. Here we study blood pressure and isolated small arteries of mice with reduced expression of Na(+) pump alpha1 (alpha1(+/-)) or alpha2 (alpha2(+/-)) catalytic subunits. Both low-dose ouabain (1-100 nm; inhibits only alpha2) and high-dose ouabain (> or =1 microm; inhibits alpha1) elevate myocyte Ca(2)(+) and constrict arteries from alpha1(+/-), as well as alpha2(+/-) and wild-type mice. Nevertheless, only mice with reduced alpha2 Na(+) pump activity (alpha2(+/-)), and not alpha1 (alpha1(+/-)), have elevated blood pressure. Also, isolated, pressurized arteries from alpha2(+/-), but not alpha1(+/-), have increased myogenic tone. Ouabain antagonists (PST 2238 and canrenone) and NCX blockers (SEA0400 and KB-R7943) normalize myogenic tone in ouabain-treated arteries. Only the NCX blockers normalize the elevated myogenic tone in alpha2(+/-) arteries because this tone is ouabain independent. All four agents are known to lower blood pressure in salt-dependent and ouabain-induced hypertension. Thus, chronically reduced alpha2 activity (alpha2(+/-) or chronic ouabain) apparently regulates myogenic tone and long-term blood pressure whereas reduced alpha1 activity (alpha1(+/-)) plays no persistent role: the in vivo changes in blood pressure reflect the in vitro changes in myogenic tone. Accordingly, in salt-dependent hypertension, EOLC probably increases vascular resistance and blood pressure by reducing alpha2 Na(+) pump activity and promoting Ca(2)(+) entry via NCX in myocytes.


Figures

Figure 1
Figure 1. Proposed mechanism for the pathogenesis of salt-dependent hypertension
Interventions such as chronic administration of exogenous ouabain, use of heterozygous null mutant mice and treatment with agents that interfere with ouabain's action or the Na+/Ca2+ exchange (NCX) are indicated on the left.
Figure 2
Figure 2. Influence of 100 nM ouabain on [Ca2+]cyt and myogenic tone in WT mouse arteries
Aa, fluo-4 pseudocolor images from a representative artery wall cross-section captured at the times (i–iv) indicated in graph b when the artery was pressurized to 70 mmHg and warmed (at the arrow) to 35°C; L, lumen. Ab, simultaneous changes in diameter (Δ diameter = 2 × wall displacement) and [Ca2+]cyt (i.e. average fluorescence in arbitrary units, a.u.) in the artery in panel a (n = 13). B, effects of 100 nm ouabain (Ouab) on the diameter of a representative artery before and after development of myogenic tone (MT) in the absence of fluo-4 (n = 4). Ouabain was applied during the periods indicated by the bars at the bottom of the graph. An intraluminal pressure of 70 mmHg was used to generate myogenic tone in these and all subsequent experiments, unless otherwise noted. PD, passive diameter; MTCtrl, control myogenic tone; MT+Ouab, myogenic tone during exposure to ouabain. Ca and Da, fluo-4 pseudocolor images captured at the times (i–iii) indicated in graphs before (Ca) and after (Da) generation of myogenic tone. Cb and Db, [Ca2+]cyt and diameter changes in representative arteries during exposure to 100 nm ouabain before (C; n = 7) and after (D; n = 8) development of myogenic tone. Ea, tangential image of a representative fura-2-loaded artery wall at 70 mmHg showing individual fluorescent myocytes orientated horizontally (the long axis of the artery is orientated vertically). Eb, average [Ca2+]cyt in individual myocytes at 20 mmHg, and before, during and after treatment with 100 nm ouabain at 70 mmHg (n = 22 myocytes from three arteries). ***P < 0.001. Scale bars: 20 μm (A and E) or 10 μm (C and D).
Figure 3
Figure 3. Effects of ouabain concentration on myogenic tone in WT arteries; roles of the Na+ pump α1 and α2 isoforms
Aa, fluo-4 pseudocolor images from a representative artery captured at the times (i–iii) indicated in graph b. Ab, simultaneous [Ca2+]cyt and diameter changes during exposure to 10 nm ouabain in an artery (Aa) with myogenic tone (n = 6). Scale bar, 10 μm. B, effect of 10 nm ouabain on myogenic tone in a representative artery in the absence of fluo-4. Ouabain (10 nm) increased myogenic tone (MT) from 21 ± 2% to 25 ± 2% of passive diameter (PD) (n = 7; P < 0.01). C, effect of 10 μm ouabain on myogenic tone in a representative artery in the absence of fluo-4. Ouabain (10 μm) increased myogenic tone (MT) from 23 ± 3% to 33 ± 4% of passive diameter (PD) (n = 5; P < 0.01). D, change in myogenic tone (ΔMT, as a percentage of control MT) graphed as a function of ouabain concentration (n = 7). Brackets at the right indicate the components of ΔMT that correspond to inhibition of the Na+ pump high ouabain affinity α2 and low ouabain affinity α1 isoforms, respectively. *P < 0.05; **P < 0.01 versus control (before ouabain); the value at 10 μm was significantly greater than at 100 nm or 1 μm (P < 0.01). E, immunoblots of Na+ pump α subunit isoform (α1, α2 and α3) distribution in mouse mesenteric artery and other tissues. Numbers are micrograms of protein per lane. Since the skeletal muscle (SkM) α1:α2 ratio is ≈1:4 (He et al. 2001; Golovina et al. 2003), the normalized band densities (see Methods) indicate that mesenteric artery α1:α2 ≈ 4:1 and heart α1:α2 ≈ 6.3:1.
Figure 4
Figure 4. The effect of nanomolar concentrations of ouabain on myogenic tone is not mediated by the endothelium, catecholamine release or myocyte depolarization
A, effect of endothelium removal on ouabain's action in a representative artery. ACh-evoked endothelium-dependent relaxation of phenylephrine (PE) vasoconstriction (E(+); blue) is absent (red) after removing endothelium. Endothelium removal (E(−)) with an intraluminal air bubble (25–30 min) did not prevent the generation of myogenic tone (MT) or the effect of 100 nm ouabain on myogenic tone (green) (n = 3). B, effect of 100 nm ouabain on myogenic tone in a representative artery in the absence (before and after, blue and green, respectively) and presence (red) of 1 μm phentolamine (n = 3). C, effects of 100 nm ouabain and 10 mm K+ on myocyte resting membrane potential (Vm) in a representative rat intact mesenteric small artery (n = 6). The electrode was withdrawn from the myocyte at the red arrow.
Figure 5
Figure 5. Na+ pump α1 and α2 isoform expression in mesenteric arteries and other tissues from WT, α1+/− and α2+/− mice
A, representative immunoblots showing Na+ pump α1, α2 and total α subunit expression levels in mesenteric arteries from WT, α1+/− and α2+/− mice. B, comparison of relative α1 expression (normalized data; see Methods) in mesenteric arteries, kidneys and hearts from WT, α1+/− and α2+/− mice (n = 3 for all bars). **P < 0.01 versus WT and α2+/−.
Figure 6
Figure 6. Effects of reduced Na+ pump α1 and α2 isoform expression and ouabain on myogenic tone and myogenic reactivity
A, effects of ouabain on myogenic tone in WT, α1+/− and α2+/− mouse arteries. Myogenic tone (MT) is shown as a percentage of passive diameter (PD). ††P < 0.05 versus WT control; *P < 0.05, **P < 0.01, ***P < 0.001 versus genotype control (numbers of arteries in parentheses). B, effects of 100 nm ouabain (Ouab; red) and reduced Na+ pump α2 expression (α2+/−; green) on passive diameter (PD, dashed lines) and myogenic reactivity to step changes in intraluminal pressure (MR, continuous lines). Blue lines, control (Ctrl) passive diameter and myogenic reactivity. Ordinate shows diameter as a percentage of passive diameter at 120 mmHg (PD120). n = 7 (WT), 6 (WT + ouabain) and 5 (α2+/−) arteries. *P < 0.05, **P < 0.01 versus WT MR; P values were determined by two-way ANOVA.
Figure 7
Figure 7. Effects of genetically reduced Na+ pump α1 or α2 isoform expression on arterial blood pressure
Mean femoral artery blood pressure (MBP) in WT, α1+/− and α2+/− mice under 1.5% isofluorane anaesthesia. ▵, individual measurements for n = 12 mice in each group; ○, mean values. Mice were age-matched: WT = 113 ± 2, α1+/−= 109 ± 4 and α2+/−= 110 ± 4 days. P values were determined by one-way ANOVA.
Figure 8
Figure 8. Effects of ouabain antagonists on myogenic tone augmented by 100 nM ouabain or by reduced α2 Na+ pump expression
A, the action of 5 μm PST 2238 on 100 nm ouabain-augmented myogenic tone (MT) in a representative WT artery. B, summary of effects of 5 μm PST 2238 and 5 μm canrenone on control myogenic tone (WT Ctrl MT), and on myogenic tone augmented by 100 nm ouabain and by reduced α2 expression (α2+/−). *P < 0.05, ***P < 0.001 versus MTCtrl in WT arteries (MTCtrl is myogenic tone in the absence of ouabain). ††P < 0.01, †††P < 0.001 versus MT+Ouab in WT arteries or MTCtrl in α2+/− arteries (numbers of arteries in parentheses).
Figure 9
Figure 9. Effects of NCX blockers on myogenic tone augmented by 100 nM ouabain or by reduced α2 Na+ pump expression
A and B, representative experiments illustrating the actions of 1 μm SEA0400 on ouabain-augmented myogenic tone in a WT artery (A) and on myogenic tone in an α2+/− artery (B). C, summary of effects of 1 μm SEA0400 and 1 μm KB-R7943 on control myogenic tone (WT Ctrl MT) and on myogenic tone augmented by 100 nm ouabain or by reduced α2 expression (α2+/−). *P < 0.05, **P < 0.01, ***P < 0.001 versus MTCtrl in WT arteries. †P < 0.05, ††P < 0.01, †††P < 0.001 versus MT+Ouab in WT arteries or MTCtrl in α2+/− arteries (numbers of arteries in parentheses).

Similar articles

Cited by

References

    1. Aalkjaer C, Mulvany MJ. Effect of ouabain on tone, membrane potential and sodium efflux compared with [3H]ouabain binding in rat resistance vessels. J Physiol. 1985;362:215–231. - PMC - PubMed
    1. Abarquez RF., Jr Digitalis in the treatment of hypertension. A preliminary report. Acta Med Philipp. 1967;3:161–170. - PubMed
    1. Aizman O, Uhlen P, Lal M, Brismar H, Aperia A. Ouabain, a steroid hormone that signals with slow calcium oscillations. Proc Natl Acad Sci U S A. 2001;98:13420–13424. - PMC - PubMed
    1. Arnon A, Hamlyn JM, Blaustein MP. Ouabain augments Ca2+ transients in arterial smooth muscle without raising cytosolic Na+ Am J Physiol Heart Circ Physiol. 2000;279:H679–H691. - PubMed
    1. Bagrov AY, Roukoyatkina NI, Pinaev AG, Dmitrieva RI, Fedorova OV. Effects of two endogenous Na+,K+-ATPase inhibitors, marinobufagenin and ouabain, on isolated rat aorta. Eur J Pharmacol. 1995;274:151–158. - PubMed

Publication types

Substances

LinkOut - more resources