. 2005 Sep;139(1):5-17.
doi: 10.1104/pp.105.063743.

Genome-wide identification and testing of superior reference genes for transcript normalization in Arabidopsis

Affiliations

Genome-wide identification and testing of superior reference genes for transcript normalization in Arabidopsis

Tomasz Czechowski et al. Plant Physiol. 2005 Sep.

Abstract

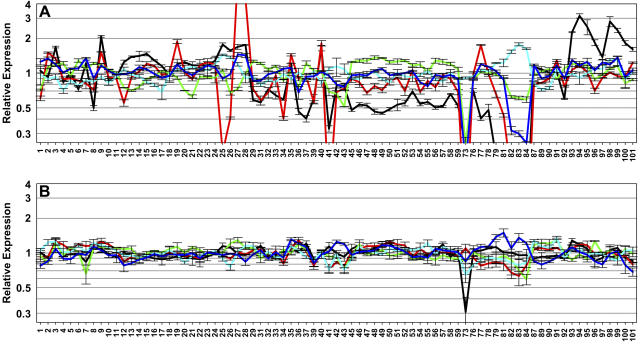
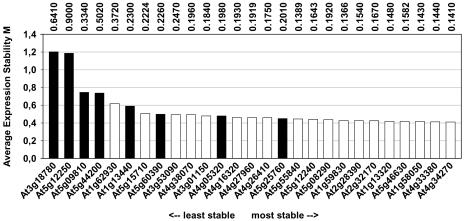
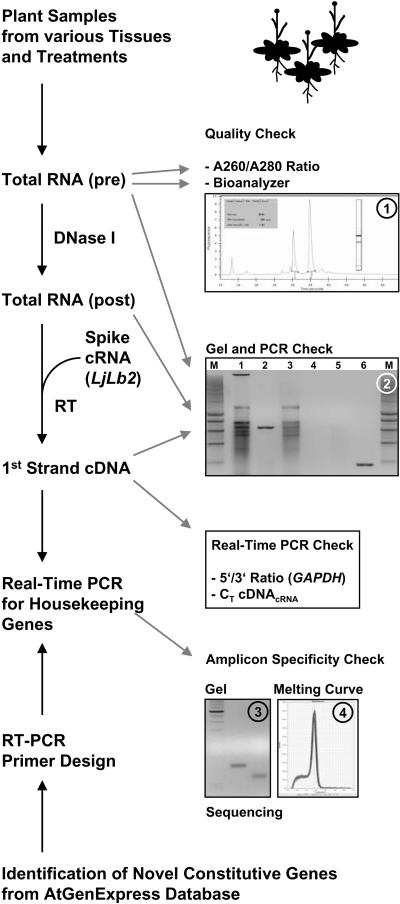
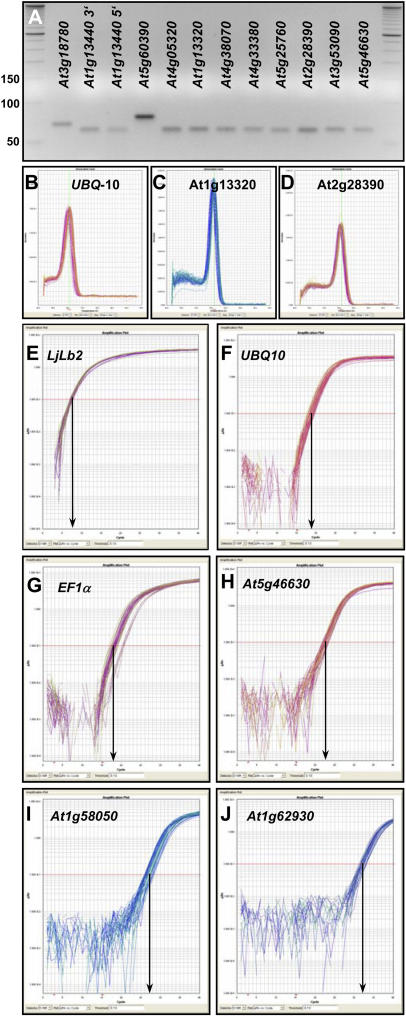
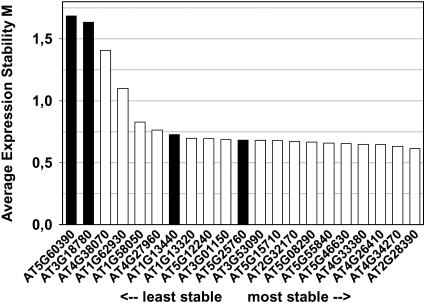
Gene transcripts with invariant abundance during development and in the face of environmental stimuli are essential reference points for accurate gene expression analyses, such as RNA gel-blot analysis or quantitative reverse transcription-polymerase chain reaction (PCR). An exceptionally large set of data from Affymetrix ATH1 whole-genome GeneChip studies provided the means to identify a new generation of reference genes with very stable expression levels in the model plant species Arabidopsis (Arabidopsis thaliana). Hundreds of Arabidopsis genes were found that outperform traditional reference genes in terms of expression stability throughout development and under a range of environmental conditions. Most of these were expressed at much lower levels than traditional reference genes, making them very suitable for normalization of gene expression over a wide range of transcript levels. Specific and efficient primers were developed for 22 genes and tested on a diverse set of 20 cDNA samples. Quantitative reverse transcription-PCR confirmed superior expression stability and lower absolute expression levels for many of these genes, including genes encoding a protein phosphatase 2A subunit, a coatomer subunit, and an ubiquitin-conjugating enzyme. The developed PCR primers or hybridization probes for the novel reference genes will enable better normalization and quantification of transcript levels in Arabidopsis in the future.


Figures

Figure 1.
Figure 1.
Relative expression level of traditional and novel reference genes during development. A, Relative expression levels for five traditional genes, i.e. ACT2 (At3g18780, black), TUB6 (At5g12250, red), EF-1α (At5g60390, green), UBQ10 (At4g05320, cyan), and GAPDH (At1g13440, blue). B, Expression levels for five novel genes, i.e. At4g34270 (black), At1g13320 (red), At1g59830 (green), At4g33380 (cyan), and At2g28390 (blue). The RMA-normalized ATH1 expression level for each gene in every sample (1–101) is expressed relative to the average expression level over the entire developmental series. The descriptions of the developmental samples 1 to 101 are available at http://www.weigelworld.org/resources/microarray/AtGenExpress/. The Affymetrix probe set for At5g60390 is not specific but detects transcripts of four EF-1α genes (see Table I).
Figure 2.
Figure 2.
geNORM ranking of 27 reference genes based on ATH1 data from the developmental series. A low value for the average expression stability M, as calculated by geNORM software, indicates a more stable expression. Seventy-nine samples including different developmental stages, organs, tissues, and genotypes were included in this analysis. Vertical numbers at the top represent the CV values of the genes for the same set of samples.
Figure 3.
Figure 3.
Flowchart of the qRT-PCR methodology. Total RNA was prepared from 20 diverse Arabidopsis plant samples. Total RNA (pre) was quality checked spectrophotometrically (A260/A280 ratio), using an Agilent Bioanalyzer (inset 1) and by gel electrophoresis (inset 2) prior to (lane 1) and after DNase I digest (lane 3; note the absence of the high Mr genomic DNA band). The presence and absence of genomic DNA contamination in total RNA samples before and after DNase I treatment, respectively, was also confirmed by PCR, using primers designed to amplify a 633-bp genomic fragment of the ACT2 gene (inset 2, compare lanes 2 and 4). Prior to RT, equal amounts of DNase I-treated RNA were spiked with a defined amount of LjLb2 cRNA as internal standard. First-strand cDNA pools were checked by (1) gel electrophoresis prior to and after PCR (inset 2, lanes 5 and 6, respectively) with the same ACT2 primers as above, which amplify a 190-bp fragment from cDNA of both annotated ACT2 splice variants; (2) determination of the 5′/3′ ratio of GAPDH cDNA amplification using two primer pairs that amplify DNA from either the 5′ or 3′ region (see Supplemental Table II and “Materials and Methods”), providing a further estimate of RNA integrity and/or processivity of reverse transcriptase in each sample; and (3) quantification of cDNALjLb2 as an independent check of cDNA synthesis efficiency and to normalize cDNA pools. Various cDNA pools were then used for qRT-PCR with primer pairs for a series of novel reference genes extracted from the AtGenExpress database as well as a few traditional reference genes. Primer pairs were all designed to work in the same PCR conditions and were checked for specificity of amplification by gel electrophoresis (inset 3), melting-curve analysis (inset 4), and sequencing of amplicons, before use.
Figure 4.
Figure 4.
Specificity and efficiency of PCR primers. A to D, Specificity of PCR amplification was confirmed by the presence of unique amplicons of the expected size following electrophoresis on agarose gels (A; compare with standard bands and Supplemental Table II), and by dissociation curves with single peaks (B–D). In each section, 54 to 60 individual melting curves are shown obtained with three technical replicates from 18 to 20 different cDNA pools. Dissociation curves and gel pictures for additional amplicons are shown in Supplemental Figures 7 and 8. E to J, Real-time qPCR amplification plots for UBQ10 (E), EF-1α gene At5g60390 (F), At5g25760 (UBC; G), At5g46630 (H), At1g58050 (I), and At1g62930 (J). Each section depicts 54 to 60 amplification curves obtained from 18 (UBQ10) or 20 different cDNA pools. The y axis of each plot shows the logarithmic fluorescence value, while the x axis represents the PCR cycle number (0–40). The gray horizontal line (red line in the online version) represents the threshold fluorescence at which the CT is determined. The slope of each plot in the linear (log) phase is used to determine amplification efficiency (E) for each reaction.
Figure 5.
Figure 5.
geNORM ranking of reference genes based on qRT-PCR data. Data from all 20 cDNA pools were considered for 21 genes (UBQ10 was omitted). Traditional and novel reference genes are shown as black and white bars, respectively. A low value for the average expression stability, M, as calculated by geNORM software, indicates more stable expression throughout the various conditions.

References

    1. Altmann T, Weigel D, Nover L (2004) AtGenExpress—Ein multinational koordiniertes Programm zur Erforschung des Arabidopsis Transkriptoms. GenomXpress 3: 13–14
    1. Andersen CL, Jensen JK, Orntoft TF (2004) Normalization of real-time quantitative reverse transcription-PCR data: a model-based variance estimation approach to identify genes suited for normalization, applied to bladder and colon cancer data sets. Cancer Res 64: 5245–5250 - PubMed
    1. Bolstad BM, Irizarry RA, Astrand M, Speed TP (2003) A comparison of normalization methods for high density oligonucleotide array data based on bias and variance. Bioinformatics 19: 185–193 - PubMed
    1. Brunner AM, Yakovlev IA, Strauss SH (2004) Validating internal controls for quantitative plant gene expression studies. BMC Plant Biol 4: 14. - PMC - PubMed
    1. Bustin SA (2002) Quantification of mRNA using real-time reverse transcription PCR RT-PCR: trends and problems. J Mol Endocrinol 29: 23–29 - PubMed

Publication types

MeSH terms