

doi: 10.1073/pnas.0506654102.
Epub 2005 Sep 15.
miR-15 and miR-16 induce apoptosis by targeting BCL2
Affiliations
- PMID: 16166262
- PMCID: PMC1236577
- DOI: 10.1073/pnas.0506654102
Item in Clipboard
miR-15 and miR-16 induce apoptosis by targeting BCL2
Proc Natl Acad Sci U S A.
.
Erratum in
- Proc Natl Acad Sci U S A. 2006 Feb 14;103(7):2464
Abstract
Chronic lymphocytic leukemia (CLL) is the most common human leukemia and is characterized by predominantly nondividing malignant B cells overexpressing the antiapoptotic B cell lymphoma 2 (Bcl2) protein. miR-15a and miR-16-1 are deleted or down-regulated in the majority of CLLs. Here, we demonstrate that miR-15a and miR-16-1 expression is inversely correlated to Bcl2 expression in CLL and that both microRNAs negatively regulate Bcl2 at a posttranscriptional level. BCL2 repression by these microRNAs induces apoptopsis in a leukemic cell line model. Therefore, miR-15 and miR-16 are natural antisense Bcl2 interactors that could be used for therapy of Bcl2-overexpressing tumors.
Figures
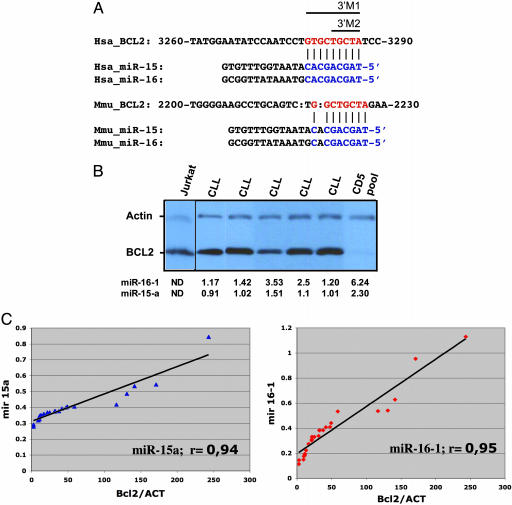
Bcl2 protein expression is inversely correlated with miR-15a and miR-16-1 miRNAs expression in CLL patients. (A) The unique site of complementarity miR::mRNA is conserved in human and mouse and is the same for all four human members of the family. The sites of target mutagenesis are indicated (3′M1 and 3′M2). (B) In CLL patients the levels of Bcl2 protein are inversely correlated with miR-15a and miR-16-1 expression. Five different CLL cases are presented, and the normal cells were pools of CD5+ B lymphocytes. The T cell leukemia Jurkat was used as control for Bcl2 protein expression. For normalization we used β-actin. The numbers represent normalized expression on miRNACHIP. ND, not determined. (C) The coefficients of correlation in the full set of 26 samples is ≈95% for both miR-15a and miR-16-1. The normalized Bcl2 expression is on abscissa vs. miR-15a (Left) and miR-16-1 (Right) levels by miRNA chip on ordinates. ACT, β-actin.
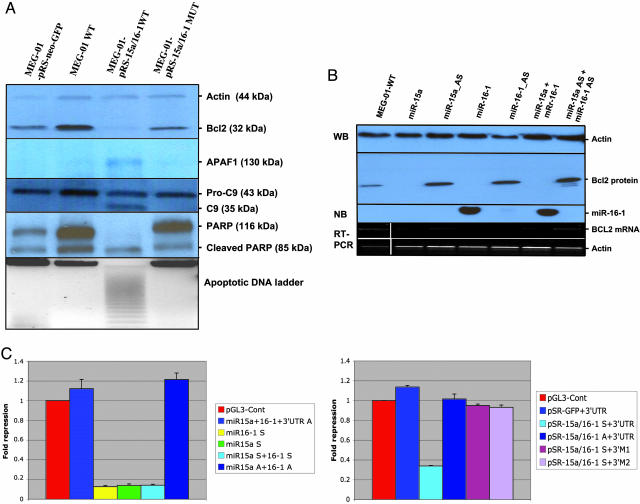
BCL2 is a target of miR-15 and miR-16.(A) Transfection of miR-15a/miR-16-1 cluster in MEG-01 BCL2+ leukemia cells is followed by a significant reduction in protein levels. Data were confirmed in duplicate experiments. The pSR-mir15/16-WT-transfected cells shows cleavage of APAF-1 (a cytochrome c interactor), pro-caspase 9 (intrinsic pathway), and PARP (a final effector of various apoptotic pathways). (B) Transfection with RNA oligos miR-15 and miR-16 separately or combined significantly reduce Bcl2 protein levels. Normalization was performed with β-actin. The Northern blot (NB) showed the miR-16-sense transfection efficiency. The same results were obtained for the other three oligos used (data not showed). The mRNA levels of the BCL2 gene in the same cells are shown and normalized against β-actin mRNA expression. WB, Western blot. (C) The 3′ UTR of BCL2 enables miR-15/16 regulation. Relative repression of firefly luciferase expression was standardized to a transfection control, Renilla luciferase. pGL-3 (Promega) was used as the empty vector. (Left) miR-15-a and miR-16-1 oligoRNAs (sense and antisense) were used for transfections. (Right) pSR-mir15/16-WT was used. Two different types of 3′ UTR mutants were constructed, one without all 9 bp of miRNA::mRNA interaction (3′M1) and the other with a deletion of the first 5 bp in the same complementarity region (3′M2). All of the experiments were performed twice in triplicate (n = 6).
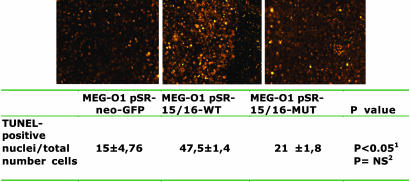
Apoptotic evaluation determined through comparison of TUNEL-positive apoptotic nuclei and total number of cells. Corresponding images to the numeric counts are presented. All values are mean ± SD for three different sets of 100 cells for each type of sample. NS, not significant. Superscript 1 indicates P values between empty vector and miR-15/16 WT. Superscript 2 indicates P values between empty vector and miR-15/16 mutated.
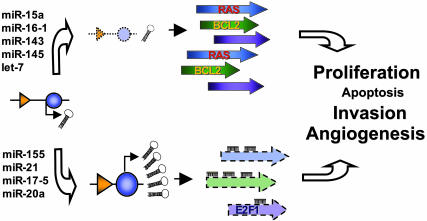
miRNAs as oncogenes and/or tumor suppressors: two different looks of the same genes. A miRNA located in a deleted region or down-regulated in a particular human cancer (a tumor suppressor miRNA) can have, in fact, oncogene-like effects if the main targets for that specific cell types are oncogenes. The absence of the miRNA will induce overexpression of the oncogenic targets, the same effect as the target amplification or activation (as was proved for let-7 and RAS in lung cancers). The same miRNA, but in a different cell type, can have as main target a tumor suppressor and therefore its deletion will increase the levels of the suppressor protein, practically protecting from malignant transformation. A miRNA located in an amplified region or overexpressed in a particular human cancer (an oncogene miRNA) can have, in fact, tumor suppressor-like effects if the main targets for that specific cell types are tumor suppressors. The abundance of the miRNA will produce down-regulation of the suppressor targets, the same effect as the loss of heterozygosity directly affecting the target gene. The same miRNA, but in a different cell type, can have as main target an oncogene, and therefore its overexpression will decrease the levels of the oncogenic protein, practically protecting the cell from malignant transformation. To completely define this puzzle, it has to be considered that, depending on cell type, the same miRNAs (as proved for miR-17-5 and miR-20a) can behave as oncogene (as shown in ref. 28) or tumor suppressor (as shown in ref. 29). Furthermore, each miRNA has more than one target, and each target has more than one interacting miRNA in a specific cell type, giving rise to a very complex and intricate regulatory network. The miRNA genes are shown in blue, and the corresponding promoters are shown in orange. For simplicity, only one allele was shown and only a few mRNA–miRNA interactions are represented.
References
-
- Cory, S. & Adams, J. M. (2002) Nat. Rev. 2, 647–656. - PubMed
-
- Sanchez-Beato, M., Sanchez-Aguilera, A. & Piris, M. A. (2003) Blood 101, 1220–1235. - PubMed
-
- Tsujimoto, Y., Finger, L. R., Yunis, J., Nowell, P. C. & Croce, C. M. (1984) Science 226, 1097–1099. - PubMed
-
- Tsujimoto, Y., Cossman, J., Jaffe, E. & Croce, C. M. (1985) Science 228, 1440–1443. - PubMed
-
- Chiorazzi, N., Rai, K. R. & Ferrarini, M. (2005) N. Engl. J. Med. 352, 804–815. - PubMed
Publication types
MeSH terms
Substances
Grants and funding
LinkOut - more resources
Full Text Sources
Other Literature Sources
Molecular Biology Databases
Research Materials
