Comparative Study
. 2005 Sep 15;19(18):2199-211.
doi: 10.1101/gad.351605.

Ribosomal protein S6 phosphorylation is a determinant of cell size and glucose homeostasis

Affiliations
Comparative Study

Ribosomal protein S6 phosphorylation is a determinant of cell size and glucose homeostasis

Igor Ruvinsky et al. Genes Dev. .

Abstract

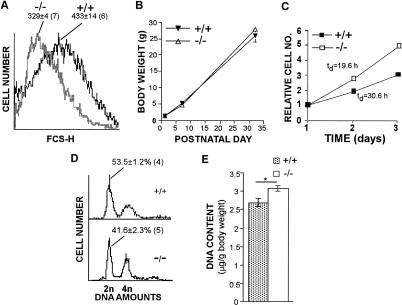
The regulated phosphorylation of ribosomal protein (rp) S6 has attracted much attention since its discovery in 1974, yet its physiological role has remained obscure. To directly address this issue, we have established viable and fertile knock-in mice, whose rpS6 contains alanine substitutions at all five phosphorylatable serine residues (rpS6(P-/-)). Here we show that contrary to the widely accepted model, this mutation does not affect the translational control of TOP mRNAs. rpS6(P-/-) mouse embryo fibroblasts (MEFs) display an increased rate of protein synthesis and accelerated cell division, and they are significantly smaller than rpS6(P+/+) MEFs. This small size reflects a growth defect, rather than a by-product of their faster cell division. Moreover, the size of rpS6(P-/-) MEFs, unlike wild-type MEFs, is not further decreased upon rapamycin treatment, implying that the rpS6 is a critical downstream effector of mTOR in regulation of cell size. The small cell phenotype is not confined to embryonal cells, as it also selectively characterizes pancreatic beta-cells in adult rpS6(P-/-) mice. These mice suffer from diminished levels of pancreatic insulin, hypoinsulinemia, and impaired glucose tolerance.


Figures

Figure 1.
Figure 1.
Generation of unphosphorylatable rpS6 allele (rpS6P-/-). (A) The structures of the endogenous rpS6 gene, targeting vector, and the mutated locus. The position of the phosphorylatable serine residues and the respective alanine substitutes in exon 5 is indicated by Ss or As, respectively. (Triangles) loxP sites; (neo) neomycin-resistance gene; (DTA) diphtheria toxin-A chain gene. (B) Southern blot of ApaLI- or Asp700-digested genomic DNA from wild-type, heterozygous, and homozygous mice hybridized to the probes are indicated at the bottom. The wild-type allele (5.7 or 5.4 kb, respectively) and targeted allele (7.8 and 4.4, respectively) are indicated. (C) PCR products of genomic DNA using primers that flank the mutated sites as specified in Materials and Methods. The products were digested with EcoRV and separated by agarose gel electrophoresis. The wild-type allele (639 bp) and the doublet of the targeted allele (339 and 305 bp) are indicated. (D) Total RNA from rpS6P+/- ES cells was extracted and subjected to RT-PCR, as described in Materials and Methods. Equal aliquots of the resulting DNA were either untreated (-) or digested by AatII (+) and separated by agarose gel electrophoresis. The wild-type allele (171 bp) and the doublet of the targeted allele (84 and 87 bp) are indicated. Total RNA (two samples for each genotype) and cytoplasmic proteins from rpS6P+/+ (+/+) and rpPS6P-/- (-/-) MEFs were subjected to Northern and Western blot analyses, using the indicated cDNA probes or antibodies, respectively. (E) Cytoplasmic extracts from rpS6P+/+ and rpPS6P-/- mice were subjected to Western blot analysis using the indicated antibodies. (C) Control liver; (R) regenerating liver. (F) Primary MEFs were serum-starved for 48 h and then serum-refed in phosphate-free medium for 2.5 h, and labeled with [32P]orthophosphate during the last 2 h. Phosphorylated polysomal proteins were analyzed as described in Materials and Methods. The positions of molecular size markers are shown at the left of the autoradiography. rpS6 migrates at 32 kDa.
Figure 2.
Figure 2.
Translational activation of TOP mRNAs does not require rpS6 phosphorylation. (A,B) Cytoplasmic extracts from untreated livers (CON) or 23 h after partial hepatectomy (PH), as well as from 72 h serum-starved (SFM) or 3 h serum-refed (Ser) MEFs were centrifuged through sucrose gradients and separated into polysomal and subpolysomal fractions. RNA from equivalent aliquots of these fractions was analyzed by Northern blot hybridization with cDNAs for SOD and rpL32 (liver) or actin and rpL32 (MEFs). The radioactive signals were quantified by PhosphorImager, and the relative translational efficiency is depicted as the average percentage of an mRNA engaged in polysomes. The data are presented as a mean (n = 2) or as a mean ± SEM (n = 3). (C) rpS6P+/+ (+/+) and rpS6P-/- (-/-) MEFs were serum-starved for 72 h and then refed for 3 h. Cytoplasmic extracts from these cells were centrifuged through sucrose gradients and separated into 12 fractions. RNA isolated from these fractions was applied to Northern blot analysis and hybridized with cDNAs for rpS6 and rpS16. The radioactive signals were quantified by PhosphorImager, and the result for each fraction is presented as the percentage of total mRNA (the vertical dashed line separates the polysomal fractions [left] and the subpolysomal fractions [right]).
Figure 3.
Figure 3.
The effect of phosphorylatable serine deficiency in rpS6 on global protein synthesis in liver and MEFs. (A) rpS6P+/+ and rpS6P-/- male mice underwent partial hepatectomy, and 23 h later cytoplasmic extracts were prepared from the remaining liver (Partial hepatectomy) or from livers of untreated mice (Control). These extracts were size-fractionated by centrifugation through sucrose gradients, and the absorbance of polysomes and subpolysomal particles was continuously monitored at 260 nm. (M) Monosomes; (60) 60S subunits; (40S) 40S subunit. The vertical dashed line separates the polysomal fraction (left) and the subpolysomal fraction (right). The areas under the curve within these fractions were estimated by weighing paper cutouts of the profiles. The proportion of the area in the polysomal fraction has been referred to as the percentage of ribosomes engaged in translation. The results are presented as a mean ± SEM (n = 4). (B) rpS6P+/+ and rpS6P-/- MEFs were pulse-labeled with [35S]methionine and [35S]cysteine, and the protein synthesis was measured and presented as described in Materials and Methods. Protein synthesis at each time point for each cell type represents a mean ± SEM (n = 3). (C) Growing rpS6P+/+ and rpS6P-/- MEFs (passage 2) were harvested at time 0 and 24 h later. Cells were lysed, and protein concentration in extracts was determined as described in Materials and Methods. The protein content at time 0 was arbitrarily set at 1, and that of 24 h was normalized to this value. Results are presented as a mean ± SEM (n = 3). (★★) P < 0.001 versus rpS6P+/+ MEFs. (D) The ribosome half-transit time in rpS6P+/+ and rpS6P-/- MEFs was determined as described in Materials and Methods. Incorporation of [3H]leucine into total protein within the PMS and PRS was obtained by linear regression analysis. The radioactivity at each time point is presented as a mean ± SEM (n = 3 and 5 for rpS6P+/+ and rpS6P-/- MEFs, respectively).
Figure 4.
Figure 4.
rpS6P-/- MEFs are smaller, yet they divide faster than the wild-type MEFs. (A) The size of nonsynchronous rpS6P+/+ (black curve) and rpS6P-/- MEFs (gray curve) was determined as described in Materials and Methods. The average size is presented as the mean FSC-H ± SEM of the number of cultured plates in parenthesis. (B) Mean body weight of rpS6P+/+ and rpS6P-/- mice (n = 13 and 14, respectively, for day 1; 12 and 13, respectively, for day 7; and 7 and 5, respectively, for day 32). Mice represent two distinct ES clones and are siblings from 11 pairs of heterozygous matings. (C) rpS6P+/+ and rpS6P-/- MEFs were seeded in a 24-well plate and, at the indicated time, cells were trypsinized and counted. The numbers of cells (average of four wells for each time point) were normalized to the number at time 0, which was arbitrarily set at 1. (D) The DNA content of rpS6P+/+ and rpS6P-/- MEFs was determined on a flow cytometer. Results are depicted as histograms with numerical values representing the percentage of cells in G1 (average ± SEM). Propidium iodide positive staining is graphed on the X-axis with cell number on the Y-axis. (E) Mice (four of each genotype) were sacrificed 24 h post-partum, and the total DNA content was measured as described in Materials and Methods. Data are presented as micrograms of DNA/gram of body weight. Vertical bars represent SEM. () P < 0.01 versus rpS6P+/+ mice.
Figure 5.
Figure 5.
The smaller size of rpS6P-/- MEFs is not a by-product of their faster cell division. (A) MEFs (passage 3) were seeded in a 96-well plate at a density of 20 × 103 per well. On the following day, cells were treated for 24 h with increasing concentrations of aphidicolin, and 3H-thymidine incorporation during the last 3 h was measured as described in Materials and Methods. Each point represents an average value of four wells. (B) rpS6P+/+ and rpS6P-/- MEFs (passage 3) were either untreated (Control) or treated with 30 μM aphidicolin for 24 h, and their size was determined as described in Materials and Methods. The average size is presented as the mean FSC-H ± SEM (n = 4). () P < 0.01 versus untreated cells. (C) The size of nonsynchronous immortalized rpS6P+/+ (black curve) and rpS6P-/- MEFs (gray curve) was determined as described in Materials and Methods. The average size is presented as the mean FSC-H ± SEM of the number of cultured plates in parentheses. (D) Immortalized MEFs were seeded in 96-well plates at a density of 4 × 10³ per well. Proliferation was monitored by measuring the A650 of the methylene-blue dye extracted from stained cells (Oliver et al. 1989). Absorbance measured 6 h after platting was set arbitrarily at 1, and absorbance measured at later time points (average ± SEM; n = 12 for each time point) was normalized to that value. (E) rpS6P+/+ and rpS6P-/- MEFs (passage 3) were either untreated (Control) or treated with 20 nM rapamycin for 48 h, and their size was determined as described in Materials and Methods. The average size is presented as a mean FSC-H ± SEM (n = 3). () P < 0.05 versus untreated cells. (F) rpS6P+/+ and rpS6P-/- MEFs (passage 3) were either untreated or treated with 20 nM rapamycin for 48 h (Rapa), and the rate of proliferation was measured as described in D. Each time point is an average ± SEM (n = 6 to 12). The bars representing the SEM in D and F are smaller than the symbols' size.
Figure 6.
Figure 6.
Pancreatic β-cells are selectively smaller in rpS6P-/- mice. Pancreatic sections from rpS6P+/+ and rpS6P-/- mice were stained for DNA by DAPI (blue in A,B, red in C,D) and for insulin (green in C,D). Panels C and D represent insertion of the RGB image from the DAPI staining into the red channel of the respective image of the insulin staining. Shown are representative islets. Bar, 50 μm. The density of β-cells (E) and acinar cells (F) was assessed by counting the number of nuclei in multiple 2500-μm2 squares within islets that contain only insulin-positive cells or within exocrine pancreas that contains only acinar cells, respectively. Values are presented as a mean ± SEM of ∼100 determinations done with five to seven islets for each cell type in four female mice of each genotype. (★★) P < 0.001 versus rpS6P+/+ mice.
Figure 7.
Figure 7.
Glucose homeostasis is damaged in rpS6P-/- mice. (A) Glucose tolerance test. Blood glucose concentrations before and after intraperitoneal injection of 2.5 g of D-glucose per kilogram of body weight in 6-wk-old mice fasted for 17 h. The data represent an average ± SEM for 11 rpS6P+/+ mice (four males and seven females) and 14 rpS6P-/- mice (nine males and five females), respectively. () P < 0.05; (★★) P < 0.005 versus rpS6P+/+ mice. (B) Insulin concentrations in 2-mo-old female mice fasted for 16 h were determined by tail bleeding. Values depict an average ± SEM for seven animals each. (★★) P < 0.005 versus rpS6P+/+ mice. (C) Total pancreatic insulin content. Pancreases from age-matched female mice were removed, and the insulin content was measured as described in Materials and Methods. The data represent an average ± SEM for five animals each. () P < 0.05 versus rpS6P+/+ mice. (D) Total β-cell mass. Pancreases from four rpS6P+/+ and seven rpS6P-/- age-matched female mice were removed, and the total β-cell mass was determined as described in Materials and Methods. The data are presented as a mean ± SEM. (E) Insulin tolerance test. Blood glucose concentrations before and after intraperitoneal injection of 0.25 U of insulin/kilogram of body weight in 2-mo-old fed female mice. The data represent an average ± SEM for five animals each. () P < 0.05; (★★) P < 0.005 versus rpS6P+/+ mice.

References

    1. Aloni R., Peleg, D., and Meyuhas, O. 1992. Selective translational control and nonspecific posttranscriptional regulation of ribosomal protein gene expression during development and regeneration of rat liver. Mol. Cell. Biol. 12: 2203-2212. - PMC - PubMed
    1. Bernal-Mizrachi E., Wen, W., Stahlhut, S., Welling, C.M., and Permutt, M.A. 2001. Islet β cell expression of constitutively active Akt1/PKBα induces striking hypertrophy, hyperplasia, and hyperinsulinemia. J. Clin. Invest. 108: 1631-1638. - PMC - PubMed
    1. Burgering B.M.T. and Coffer, P.J. 1995. Protein kinase B (c-Akt) in phosphatidylinositol-3-OH kinase signal transduction. Nature 376: 599-602. - PubMed
    1. Chan Y. and Wool, I. 1988. The primary structure of rat ribosomal protein S6. J. Biol. Chem. 263: 2891-2896. - PubMed
    1. Chung J., Kuo, C.J., Crabtree, G.R., and Blenis, J. 1992. Rapamycin-FKBP specifically blocks growth-dependent activation of and signaling by the 70 kD S6 kinases. Cell 69: 1227-1236. - PubMed

Publication types

MeSH terms