. 2005 Oct;25(19):8520-30.
doi: 10.1128/MCB.25.19.8520-8530.2005.

Protein kinase D mediates mitochondrion-to-nucleus signaling and detoxification from mitochondrial reactive oxygen species

Affiliations

Protein kinase D mediates mitochondrion-to-nucleus signaling and detoxification from mitochondrial reactive oxygen species

Peter Storz et al. Mol Cell Biol. 2005 Oct.

Abstract

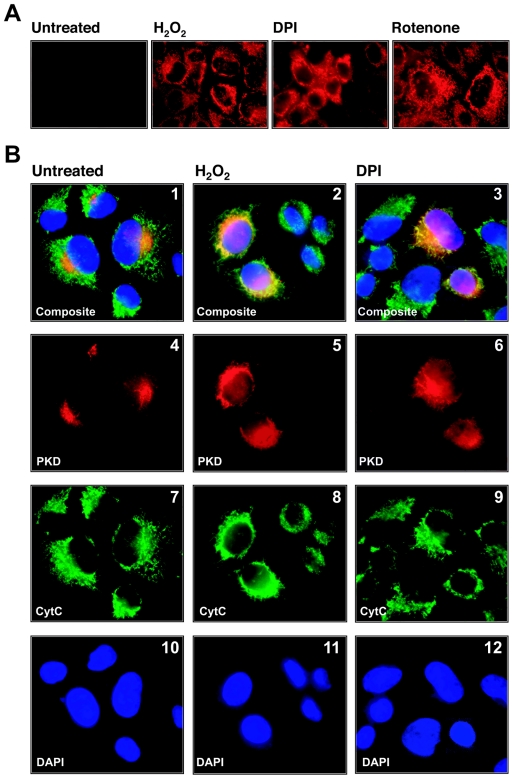
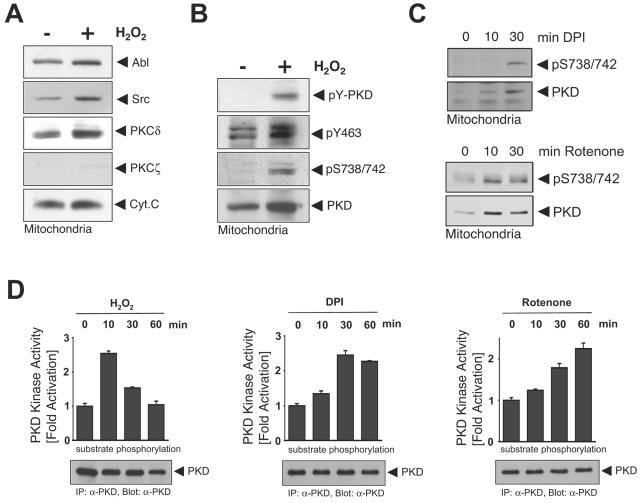
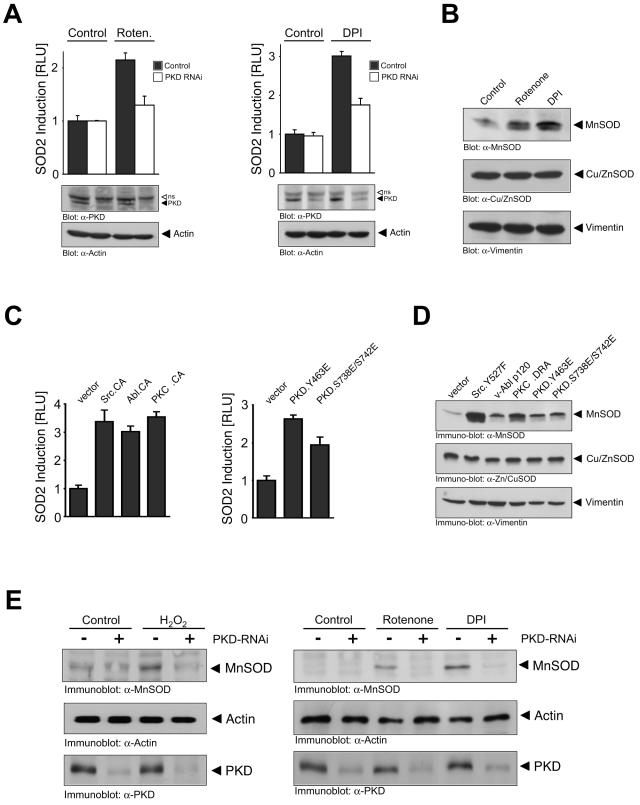
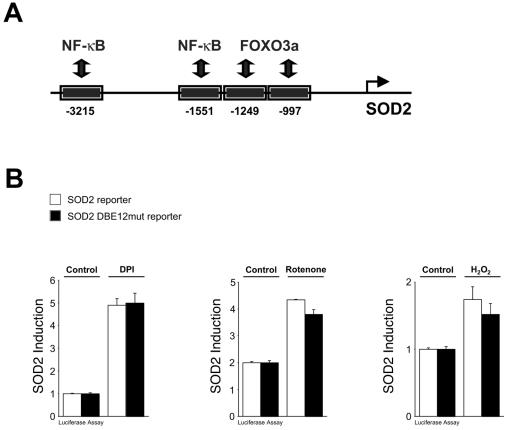
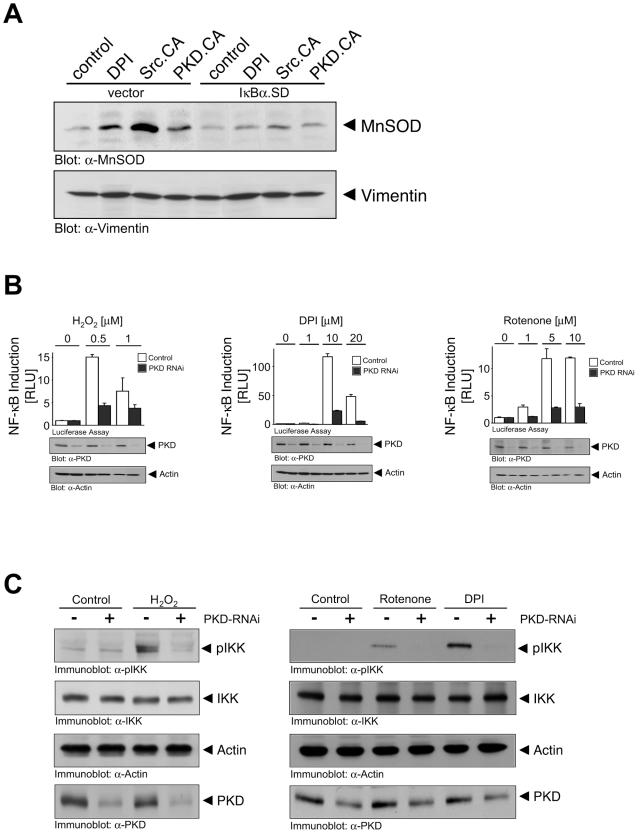
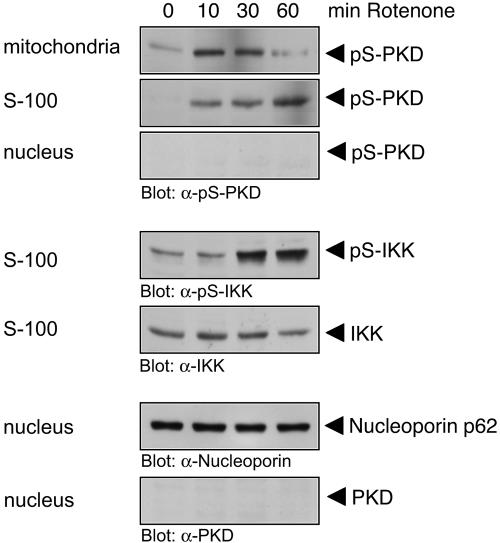
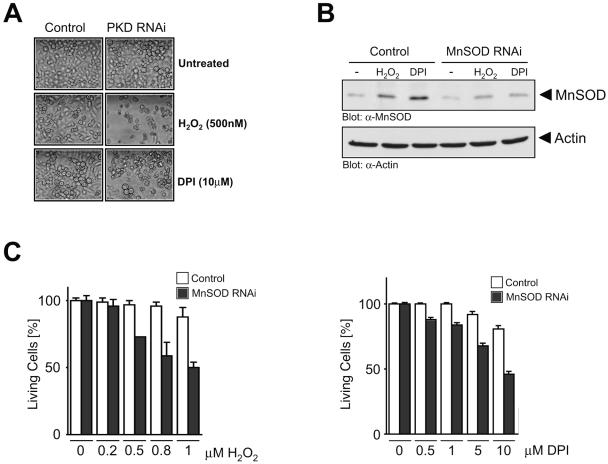
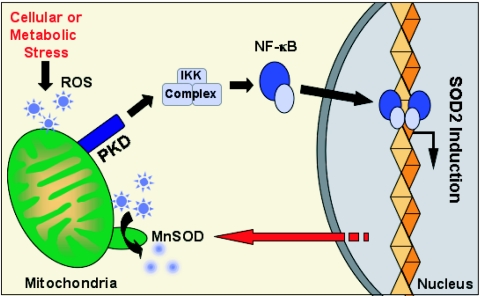
Efficient elimination of mitochondrial reactive oxygen species (mROS) correlates with increased cellular survival and organism life span. Detoxification of mitochondrial ROS is regulated by induction of the nuclear SOD2 gene, which encodes the manganese-dependent superoxide dismutase (MnSOD). However, the mechanisms by which mitochondrial oxidative stress activates cellular signaling pathways leading to induction of nuclear genes are not known. Here we demonstrate that release of mROS activates a signal relay pathway in which the serine/threonine protein kinase D (PKD) activates the NF-kappaB transcription factor, leading to induction of SOD2. Conversely, the FOXO3a transcription factor is dispensable for mROS-induced SOD2 induction. PKD-mediated MnSOD expression promotes increased survival of cells upon release of mROS, suggesting that mitochondrion-to-nucleus signaling is necessary for efficient detoxification mechanisms and cellular viability.


Figures

FIG. 1.
FIG. 1.
Mitochondrial oxidative stress locates PKD to the mitochondria. (A) Cells were incubated for 15 min with the reduced MitoTracker Red (CM-H2XRos) dye. The cell culture medium then was replaced, and cells were either left untreated or stimulated with H2O2 (10 μM, 10 min), DPI (20 μM, 60 min), or rotenone (20 μM, 60 min). (B) Cells were transfected with HA-tagged PKD and 24 h after transfection seeded on glass coverslips. Cells were stimulated with H2O2 (10 μM, 10 min) or DPI (20 μM, 1 h) and stained as described in Materials and Methods (PKD, anti-HA [α-HA], red; anti-cytochrome c, [α-CytC], green; nuclei, DAPI, blue).
FIG. 2.
FIG. 2.
Mitochondrial oxidative stress activates PKD at the mitochondria. (A to C) Cells were stimulated with H2O2 (10 μM, 10 min), DPI (20 μM), or rotenone (10 μM) as indicated. Mitochondrial fractions were prepared, and lysates were resolved by SDS-PAGE and immunoblotted against the indicated proteins. All results are typical of three independent experiments. (D) Cells were stimulated with H2O2 (10 μM), DPI (20 μM), or rotenone (10 μM) for the indicated times. PKD was immunoprecipitated (IP), and a PKD substrate kinase assay was performed. Expression of PKD was determined by immunoblotting with anti-PKD (α-PKD; bottom panels).
FIG. 3.
FIG. 3.
ROS-stimulated PKD activation induces SOD2 and MnSOD. (A) Cells were transfected with vector control (pSuper) or PKD1/2 RNAi (pSuper PKD1/pSuper PKD2) for 24 h. Then cells were transfected a second time with reporter constructs and 8 h after transfection stimulated with rotenone (Roten.; 10 μM, 16 h) or DPI (1 μM, 16 h). Reporter gene assays were performed to measure SOD2 gene reporter transcriptional activity (SOD2-luciferase reporter plasmid) or β-galactosidase activity. Error bars represent standard deviation. Protein expression was controlled by immunoblotting against PKD (anti-PKD [α-PKD]) and actin (antiactin [α-Actin]). The open arrow indicates a nonspecific (ns) band detected by the anti-PKD antibody. (B) Cells were stimulated with rotenone (10 μM, 8 h) or DPI (20 μM, 8 h), and lysates were immunoblotted against MnSOD (anti-MnSOD [α-MnSOD), Cu/ZnSOD (anti-Cu/ZnSOD [α-Cu/ZnSOD]), or vimentin (antivimentin [α-Vimentin]). (C) Cells were transfected with the SOD2 or β-galactosidase reporters and either vector alone or active alleles of Src (Src.Y527F, Src.CA), Abl (v-Abl p120, Abl.CA), PKCδ (PKCδ.DRA, PKCδ.CA), or PKD (PKD.Y463E or PKD.S738E/S742E). After 16 h, luciferase and β-Gal reporter gene assays were performed. Protein expression was controlled by immunoblot analysis (not shown). (D) Cells were transfected with active alleles of Src (Src.Y527F), Abl (v-Abl p120), PKCδ (PKCδ.DRA), or PKD (PKD.Y463E or PKD.S738E/S742E). After 16 h, lysates were analyzed for MnSOD (anti-MnSOD), Cu/ZnSOD (anti-Cu/ZnSOD), or vimentin (antivimentin) expression. (E) Cells were transfected with vector control (pSuper) or PKD RNAi (pSuper PKD1/2) for 48 h and then treated with H2O2 (16 h, 1 μM), rotenone (5 μM), or DPI (10 μM). MnSOD expression and PKD silencing by RNAi were analyzed by immunoblot analysis using anti-MnSOD or anti-PKD antibodies. Analysis of actin (antiactin) expression served as a loading control.
FIG. 4.
FIG. 4.
Mitochondrial oxidative stress regulates the SOD2 gene via NF-κB. (A) Schematic overview of FOXO3a and NF-κB binding sites in the SOD2 promoter (9, 10). (B) Cells were transfected with reporter constructs (SOD2-luciferase reporter plasmid or SOD2 DBE12mut-luciferase reporter plasmid) and 8 h after transfection stimulated with DPI (1 μM, 16 h), rotenone (20 μM, 16 h), or H2O2 (500 nM, 16 h). Reporter gene assays were performed to measure SOD2 gene reporter transcriptional activity or β-galactosidase activity (normalization). Error bars represent standard deviation.
FIG. 5.
FIG. 5.
PKD regulates the SOD2 gene via NF-κB. (A) Cells were transfected with vector control or superdominant IκBα and active Src or active PKD as indicated for 16 h or stimulated with DPI (10 μM). After 16 h, lysates were analyzed for MnSOD (anti-MnSOD [α-MnSOD]) or vimentin (antivimentin [α-Vimentin]) expression. (B) Cells were transfected with vector control (pSuper) or PKD1/2 RNAi (pSuper PKD1/pSuper PKD2) for 24 h. Cells were transfected in a second transfection with reporter constructs (NF-κB-luc, β-galactosidase) and 8 h after transfection stimulated with H2O2, rotenone, or DPI as indicated for 16 h. Reporter gene assays were performed to measure NF-κB reporter activity or β-galactosidase activity. Error bars represent standard deviation. Protein expression was controlled by immunoblotting against PKD (anti-PKD [α-PKD]) and actin (antiactin [α-Actin]). (C) Cells were transfected with vector control (pSuper), or PKD RNAi (pSuper PKD1/2) for 48 h and then treated with H2O2 (10 min, 10 μM), rotenone (60 min, 20 μM), or DPI (60 min, 20 μM) and immunoblotted for phospho-IKK and IKK. Actin protein levels and PKD knockdown by RNAi were analyzed by immunoblot analysis using antiactin or anti-PKD antibodies.
FIG. 6.
FIG. 6.
Correlation of mitochondrial PKD activation with IKK activation. Cells were stimulated with rotenone (10 μM) over time as indicated. Mitochondrial, cytosolic (S-100), or nuclear fractions were prepared, and lysates were resolved by SDS-PAGE and immunoblotted against the indicated proteins. α-, anti-.
FIG. 7.
FIG. 7.
PKD and MnSOD control cellular survival in response to mitochondrial oxidative stress. (A) Cells were transfected with vector control (pSuper) or PKD RNAi (pSuper PKD1/2) for 48 h. Cells were treated with DPI (10 μM) or H2O2 (500 nM) for 16 h and photographed. Silencing of PKD protein was measured by immunoblotting (see Fig. S5 in the supplemental material). (B) Cells were transfected with vector control (pSuper) or MnSOD RNAi (pSuper MnSOD) for 48 h and stimulated with DPI (10 μM) or H2O2 (1 μM) for 16 h. MnSOD induction and silencing were analyzed by immunoblotting. (C) Cells were transfected with vector control (pSuper) or MnSOD RNAi (pSuper MnSOD) for 48 h. Cells were treated with increasing concentrations of DPI or H2O2 as indicated for 16 h. Living cells were analyzed by crystal violet staining. Error bars represent standard deviation. α-, anti-.
FIG. 8.
FIG. 8.
Proposed model for the mitochondrion-to-nucleus signaling, regulation of SOD2 gene expression, and mitochondrial detoxification in response to mROS.

References

    1. Barnham, K. J., C. L. Masters, and A. I. Bush. 2004. Neurodegenerative diseases and oxidative stress. Nat. Rev. Drug Discov. 3:205-214. - PubMed
    1. Brummelkamp, T. R., R. Bernards, and R. Agami. 2002. A system for stable expression of short interfering RNAs in mammalian cells. Science 296:550-553. - PubMed
    1. Brunet, A., A. Bonni, M. J. Zigmond, M. Z. Lin, P. Juo, L. S. Hu, M. J. Anderson, K. C. Arden, J. Blenis, and M. E. Greenberg. 1999. Akt promotes cell survival by phosphorylating and inhibiting a Forkhead transcription factor. Cell 96:857-868. - PubMed
    1. Brunet, A., L. B. Sweeney, J. F. Sturgill, K. F. Chua, P. L. Greer, Y. Lin, H. Tran, S. E. Ross, R. Mostoslavsky, H. Y. Cohen, L. S. Hu, H. L. Cheng, M. P. Jedrychowski, S. P. Gygi, D. A. Sinclair, F. W. Alt, and M. E. Greenberg. 2004. Stress-dependent regulation of FOXO transcription factors by the SIRT1 deacetylase. Science 303:2011-2015. - PubMed
    1. Finkel, T., and N. J. Holbrook. 2000. Oxidants, oxidative stress and the biology of ageing. Nature 408:239-247. - PubMed

Publication types

MeSH terms