. 2005 Oct;25(19):8656-68.
doi: 10.1128/MCB.25.19.8656-8668.2005.

Centrosomal microtubule nucleation activity is inhibited by BRCA1-dependent ubiquitination

Affiliations

Centrosomal microtubule nucleation activity is inhibited by BRCA1-dependent ubiquitination

Satish Sankaran et al. Mol Cell Biol. 2005 Oct.

Abstract

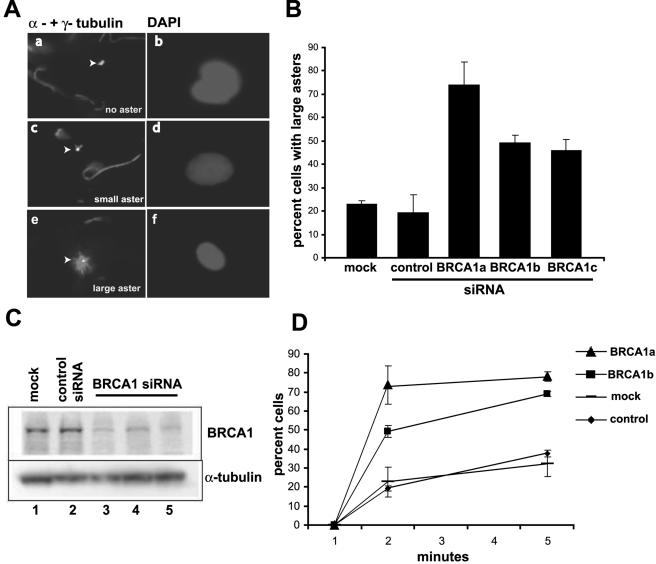
In this study we find that the function of BRCA1 inhibits the microtubule nucleation function of centrosomes. In particular, cells in early S phase have quiescent centrosomes due to BRCA1 activity, which inhibits the association of gamma-tubulin with centrosomes. We find that modification of either of two specific lysine residues (Lys-48 and Lys-344) of gamma-tubulin, a known substrate for BRCA1-dependent ubiquitination activity, led to centrosome hyperactivity. Interestingly, mutation of gamma-tubulin lysine 344 had a minimal effect on centrosome number but a profound effect on microtubule nucleation function, indicating that the processes regulating centrosome duplication and microtubule nucleation are distinct. Using an in vitro aster formation assay, we found that BRCA1-dependent ubiquitination activity directly inhibits microtubule nucleation by centrosomes. Mutant BRCA1 protein that was inactive as a ubiquitin ligase did not inhibit aster formation by the centrosome. Further, a BRCA1 carboxy-terminal truncation mutant that was an active ubiquitin ligase lacked domains critical for the inhibition of centrosome function. These experiments reveal an important new functional assay regulated by the BRCA1-dependent ubiquitin ligase, and the results suggest that the loss of this BRCA1 activity could cause the centrosome hypertrophy and subsequent aneuploidy typically found in breast cancers.


Figures

FIG. 1.
FIG. 1.
Inhibition of BRCA1 expression caused hyperactive MT regrowth in Hs578T cells. (A) Representative fields of the three different aster morphologies scored in the in vivo MT regrowth assay are shown. The left panels show α- and γ-tubulin staining, which mark MTs and centrosomes, respectively, and the right panels show 4′,6′-diamidino-2-phenylindole (DAPI) staining, which marks the position of the nucleus. All images were reproduced at the same magnification. Inactive centrosomes (Aa) and small asters (Ac) were obtained after transfection of Hs578T cells with the control siRNA. Large asters (Ae) were observed in cells transfected with the BRCA1-specific siRNA. Large asters have ∼10 microtubules of length, comparable to the nucleus, whereas small asters have 1 or 2 very short microtubules associated with the centrosome. Arrowheads indicate centrosomes and asters. (B) Hs578T cells were transfected with BRCA1-specific siRNAs, a control siRNA specific for luciferase, or no siRNA (mock). Forty-eight hours posttransfection, cells were subjected to the MT regrowth assay. The cells were fixed and stained after MT regrowth was allowed for 2 min. The percentages of cells with large asters, plus the standard errors of the means, from three independent experiments are graphed. (C) Western blot analysis of BRCA1 protein levels after cells were either transfected with siRNAs specific for the control (lane 2), BRCA1a (lane 4), BRCA1b (lane 3), or BRCA1c (lane 5) or mock transfected (lane 1). α-Tubulin levels were determined on the same blot as a control for equal loading. (D) Time course of the regrowth assay and the appearance of cells containing large asters after either no siRNA transfection (mock) or transfection with two different siRNAs specific for BRCA1 (BRCA1a and BRCA1b) or a control siRNA, as indicated. The data for the 2-min time point were averaged from three experiments, and the data for the 5-min time point were averaged from four experiments.
FIG. 2.
FIG. 2.
Expression of a BRCA1-inhibiting peptide, BIF, caused hyperactive aster formation. (A) Schematic representation of BRCA1 showing the various domains. The RING domain (residues 1 to 110) is present at the amino terminus, residues 504 to 803 have been shown to bind γ-tubulin (18), and residues 1650 to 1800 bind to RHA. The BRCA1 binding domain of RHA (residues 89 to 344), named BIF, is shown. Also indicated is the BRCA1 carboxy-terminal domain (BRCT). (B) Hs578T cells cotransfected with either the vector or the BIF plasmid, along with the GFP-centrin plasmid. Forty-eight hours posttransfection, cells were subjected to the MT regrowth assay. The cells were fixed and stained after MT regrowth was allowed for 5 min. MTs were stained with an α-tubulin antibody, and the GFP-centrin marked the centrosomes of transfected cells (left panels). DAPI (4′,6′-diamidino-2-phenylindole) was used to stain the nuclei (right panels). Bar, 10 μm. (C) Histogram of the percentage of cells with the three different aster morphologies after transfection with the vector or the BIF plasmid as described for panel B. The results of two repeat experiments were averaged.
FIG.3.
FIG.3.
BRCA1 inhibits centrosome function during early S phase. (A) Hs578T cells were transfected with a siRNA specific for BRCA1 (BRCA1a) or a control siRNA and 30 h posttransfection were either treated with either 20 mM HU or 2 mM thymidine or left untreated. The effects of these chemicals on the cell cycle were checked by FACS analysis (left panels). The positions indicating 2n and 4n DNA content are shown by arrowheads. Results of the MT regrowth assays (2-min time point) for these cells are shown at the right. Histograms are shown of the percentage of cells 48 h posttransfection with three different aster morphologies: no aster (white bars), small asters (gray bars), or large asters (black bars). (B) Hs578T cells were transfected with either BRCA1a or control siRNAs, followed by HU treatment as described for panel A, and subjected to the MT regrowth assay. Cells were fixed and stained for α- and γ-tubulin (left) or 4′,6′-diamidino-2-phenylindole (DAPI) (right). Representative fields are shown containing cells transfected with a siRNA specific for the control (top) or for BRCA1 (bottom), and these cells were assayed for MT regrowth for 2 min after removal of nocodazole. Bar, 10 μm. (C) (a) Hs578T cells were transfected with either a BRCA1-specific siRNA (BRCA1a) (bottom) or a control siRNA (top), and 30 h posttransfection, cells were treated with 20 mM HU. At 48 h posttransfection, the cells were treated with nocodazole for 40 min to depolymerize MTs, and then cells were fixed and stained for α- as well as γ-tubulin. Under these conditions, α-tubulin stains the centriole. (b) Signal intensities for α- and γ- tubulin staining, as in panel Ca, were measured for 20 randomly selected cells. The ratio of the mean intensity of γ-tubulin to that of α-tubulin was plotted for the cells transfected with a control siRNA or a siRNA specific for BRCA1. Under similar conditions the ratios of mean intensities for γ-tubulin to centrin (c), pericentrin to α-tubulin (d), and pericentrin to centrin (e) were plotted for 20 randomly selected cells.
FIG. 4.
FIG. 4.
BRCA1 localizes to centrosomes throughout the cell cycle. Hs578T cells were either blocked with 20 mM HU (a and b) or 1 μg/ml aphidicolin (c and d) for 18 h. MTs were depolymerized using 25 μM nocodazole for 40 min on ice. Nocodazole was washed off, and cells were extracted with saponin at room temperature, fixed with cold acetone, and stained for BRCA1 and γ-tubulin. Asynchronous cells were also stained for BRCA1 and γ-tubulin using the same protocol, and cells from different cell cycle stages were observed based on the stage of duplication of their centrosomes. Cells in G1 (e and f), early S (g and h), S (i and j), and M (prophase) (k and l) phases are shown. All cells are shown at the same magnification. White arrowheads indicate the positions of centrosomes.
FIG. 5.
FIG. 5.
Expression of mutant γ-tubulin in cells recapitulates the effect on MT regrowth observed with BRCA1 inhibition. (A) Hs578T cells were transfected with a plasmid expressing wild-type γ-tubulin (wt), γ-tubulin with lysine 344 mutated to arginine (K344R), or γ-tubulin with lysine 48 mutated to arginine (K48R), or the vector control (mock), and the expression of these different constructs was tested by immunoblot analysis using an antibody specific for the HA tag present on these proteins (top panel) or an anti-γ-tubulin antibody for the endogenous protein (bottom panel). (B) Hs578T cells were transfected with the various γ-tubulin-expressing constructs described for panel A and cotransfected with a GFP-centrin-expressing plasmid. Forty-eight hours posttransfection, the MT regrowth assay was done on these cells, and α-tubulin was stained. Those cells on the coverslip that were positive for expression of transfected DNA had green-stained centrosomes due to GFP-centrin expression (not shown). The percentage of transfected cells (expressing GFP-centrin) containing large asters is shown for each condition. (C) In the same slide used for panel B, the number of centrosomes per cell was counted using GFP-centrin. The percentage of transfected cells containing more than two centrosomes is shown in the histogram for each condition.
FIG. 6.
FIG. 6.
BRCA1-dependent ubiquitination activity inhibits aster formation in vitro. (A) Centrosomes purified from Hs578T cells were preincubated with ubiquitination factors comprising E1, E2, and ubiquitin (Ub) and with 30 nM BRCA1/BARD1 (B/B) as indicated and were then allowed to form asters in the presence of Xenopus extract. The centrosomes were then spun onto glass coverslips and visualized by double staining with antibodies against α-tubulin (red) and γ-tubulin (green). Representative fields are shown containing asters formed after treatments as labeled in the bottom right corner of each panel. Centrosomes were preincubated without ubiquitination factors or BRCA1/BARD1 (top left), with ubiquitination factors (top right), with both ubiquitination factors and BRCA1/BARD1 (bottom left), or with BRCA1/BARD1 but without ubiquitination factors (bottom right). Bar, 10 μm. (B) The mean of the product of fluorescence intensity and area (Mt content), expressed in arbitrary fluorescence units, was calculated for 40 asters from each condition explained above for panel A in two independent experiments. The average values were normalized with respect to the control reaction, which had no BRCA1/BARD1, E1, E2, or ubiquitin added (set at 100%), and values are shown as percentages with the standard errors of the mean. (C) Centrosomes purified from HeLa S3 cells were preincubated with ubiquitination factors as for panel A, except that in each reaction a single component was omitted. The MT content of asters was calculated as described for panel B, and the average values normalized to a control reaction (set at 100%) are shown with standard errors of the means.
FIG. 7.
FIG. 7.
Mutation or inhibition of the BRCA1/BARD1 ubiquitin ligase causes a loss of regulation of the MT nucleation function of centrosomes. (A) Centrosomes purified from HeLa S3 cells were preincubated with the ubiquitination factors and the following concentrations of BRCA1/BARD1: 0 nM (panel Aa), 7.5 nM (panel Ab), 15 nM (panel Ac), 30 nM (panel Ad), and 60 nM (panel Ae). After these preincubation reactions, centrosomes were incubated with Xenopus extract and resultant asters were processed as for Fig. 6. Asters were stained for γ-tubulin (green) and α-tubulin (red). Representative asters from each reaction are shown. The γ-tubulin content of the same asters is shown in panels a′ to e′. (Af) The MT content of 20 randomly chosen asters from each reaction was measured for reactions containing different concentrations of full-length wild-type BRCA1/BARD1 (diamonds), BRCA1(1-500)/BARD1 (triangles), and full-length mutant BRCA1(I26A)/BARD1 (squares). All reactions were normalized to the reaction in the absence of any added BRCA1/BARD1 (set at 100%). Mean MT contents and standard errors of the means are shown. (Ag) Centrosomes purified from HeLa cells were incubated with ubiquitination factors and either no BRCA1/BARD1 (lane 1), full-length wild-type BRCA1/BARD1 (B/B) at 15 nM (lane 2), 30 nM (lane 3), or 45 nM (lane 4), or BRCA1(1-500)/BARD1 at 15 nM (lane 5), 30 nM (lane 6), or 45 nM (lane 7). Samples were subjected to immunoblot analysis using a monoclonal antibody specific for human γ-tubulin. Monoubiquitinated γ-tubulin is indicated by the arrowhead at the right. The positions of the 50- and 64-kDa markers are shown on the left. (Ah) HeLa centrosomes were incubated as for panel Ag above, with either no BRCA1/BARD1 (lane 1), 30 nM full-length wild-type BRCA1/BARD1 (lane 2), or full-length mutant BRCA1(I26A)/BARD1 at 30 nM (lane 3) or 45 nM (lane 4). The immunoblot was analyzed as for panel Ag. (B) Centrosomes purified from HeLa cells were preincubated with E1, E2, ubiquitin, 30 nM full-length wild-type BRCA1/BARD1, and either 0.45, 0.9, or 3.5 μM of GST-BIF peptide or 3.5 μM of the GST-control peptide. The BIF peptide contains RHA amino acid residues 89 to 344, and the control peptide contains RHA residues 1 to 250.

Similar articles

Cited by

References

    1. Alberg, A. J., and K. J. Helzlsouer. 1997. Epidemiology, prevention, and early detection of breast cancer. Curr. Opin. Oncol. 9:505-511. - PubMed
    1. Aldaz, H., L. M. Rice, T. Stearns, and D. A. Agard. 2005. Insights into microtubule nucleation from the crystal structure of human gamma-tubulin. Nature 435:523-527. - PubMed
    1. Andersen, J. S., C. J. Wilkinson, T. Mayor, P. Mortensen, E. A. Nigg, and M. Mann. 2003. Proteomic characterization of the human centrosome by protein correlation profiling. Nature 426:570-574. - PubMed
    1. Anderson, S. F., B. P. Schlegel, T. Nakajima, E. S. Wolpin, and J. D. Parvin. 1998. BRCA1 protein is linked to the RNA polymerase II holoenzyme complex via RNA helicase A. Nat. Genet. 19:254-256. - PubMed
    1. Bornens, M., M. Paintrand, J. Berges, M. C. Marty, and E. Karsenti. 1987. Structural and chemical characterization of isolated centrosomes. Cell Motil. Cytoskel. 8:238-249. - PubMed

Publication types

MeSH terms

LinkOut - more resources